
Published: May 12, 2020; Last updated: June 12, 2020
Share on: Twitter / Facebook; Main article: Facts about Covid-19
1) Covid-19 infection fatality rates (IFR) based on antibody studies
Immunological research indicates that serological antibody studies, which measure antibodies in the blood (IgG and IgM) and typically found population-based IFR values between 0.1% and 0.5%, may detect at most 20% of infections, as most people neutralize the coronavirus with their mucosal (IgA) or cellular (T cells) immune system while developing only mild symptoms or no symptoms. This means serological IFR values may drop by a factor of five to values at or below 0.1%.
Population-based antibody seroprevalence studies:
| Country | Published | Population | IFR (%) | Source |
| Global | June 8 | 23 studies | 0.25¹ | Study |
| Germany | May 4 | Heinsberg Cluster | <0.36² | Study |
| Iran | May 1 | Guilan province | <0.12 | Study |
| USA | April 30 | Santa Clara County | 0.17 | Study |
| Denmark | April 28 | Blood donors (<70y) | 0.08 | Study |
| USA | April 24 | Miami-Dade County | <0.18 | Report |
| USA | April 21 | Los Angeles County | <0.20 | Study |
1) Median value; 2) The adjusted IFR is 0.27% (page 9). Note: Some of these studies are preprints.
2) Covid-19 infection fatality rates based on controlled PCR studies
Controlled PCR studies in population subgroups.
| Country | Date | Population | IFR (%) | Source |
| France | May 21 | Health workers | 0.05 | Study |
| USA | May 10 | MLB employees | 0.00 | Report |
| France | May 10 | Aircraft carrier | 0.00 | Report |
| USA | May 10 | Aircraft carrier | 0.09 | Report |
| USA | May 1 | Tennessee prison | 0.00 | Report |
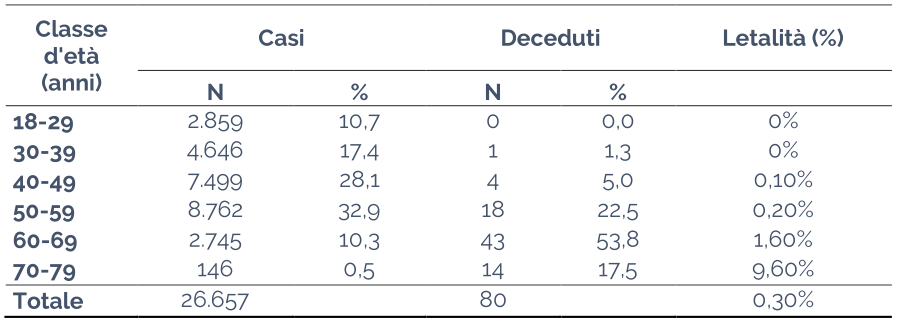
| Italy | April 28 | Health workers | 0.30¹ | Study |
| USA | April 17 | Boston homeless | 0.00 | Report |
| USA | April 17 | Boston blood donors | 0.00 | Report |
| Greece | April 16 | Repatriations | 0.00 | Study |
| USA | April 13 | NYC pregnant women | 0.00 | Study |
| Ship | March 17 | Diamond Princess | 0.13² | Study |
1) See table below; 2) Age-adjusted IFR based on US population.
3) Covid-19 infection fatality rates based on models
Covid-19 IFR based on epidemiological models or predictions. These values are often somewhat higher than the actual values based on serological antibody studies (see above).
| Country | Published | Population | IFR (%) | Source |
| USA | May 20 | CDC estimate | 0.26¹ | Study |
| France | May 13 | France | 0.70 | Study |
| Switzerland | May 11 | Switzerland | 0.40 | Study |
| UK | May 7 | UK | 0.08² | Study |
| France | May 7 | France | 0.80³ | Study |
| Global | May 6 | Metastudy | 0.64 | Study |
| Global | May 5 | Global | 0.17 | Study |
| India | May 3 | India | 0.41 | Study |
| Italy USA |
April 20 | Lombardia New York City |
>0.84 >0.50 |
Study |
| China | March 30 | Mainland China | 0.66 | Study |
| China | March 13 | Wuhan city | 0.12 | Study |
| China | March 9 | Mainland China | 0.50 | Study |
1) 0.4% symptomatic CFR and 35% asymptomatic cases; 2) Based on 29% prevalence and 50,000 deaths; 3) The IFR is 0.50 excluding nursing homes.

4) Additional antibody and PCR studies
These studies determine the prevalence of recent or current Covid-19 infections in a population or region. In most cases, they find that Covid-19 is much more widespread than previously assumed, with most people showing no or only mild symptoms.
| Country | Published | Population | Prev. | Factor | Source |
| Russia | June 10 | Russia | 14% | 40x | Report |
| USA | May 15 | Boston | 12.5% | 8x | Report |
| Czech Rep. | May 15 | South Bohemia | 5% | 10x | Report |
| USA | May 13 | Indiana | 2.8% | 11x | Report |
| Spain | May 13 | Spain Madrid |
5% 11.3% |
10x | Study |
| UK | May 8 | UK | 29% | 200x | Study |
| Switzerland | May 6 | Geneva | 9.7% | 10x | Study |
| Global | May 5 | < 65 years old | Study | ||
| Japan | May 5 | Kobe City | 2.7% | 396x | Study |
| USA | May 2 | New York State New York City |
12.3% 19.9% |
8x 10x |
Report |
| Spain | May 2 | Health workers | 11.2% | Study | |
| Netherlands | April 29 | Blood donors | 2.7% | Study | |
| France | April 23 | Northern France | 3% | Study | |
| USA | April 19 | Chelsea MA | 32% | 16x | Report |
| Iceland | April 14 | Iceland (PCR) | 0.8% | Study |
5) Median age of Covid-19 deaths per country
Half of all deaths were below, half were above the median age.
| Country | Median age |
Source |
| Austria | 80+ years | EMS |
| England | 80+ years | NHS |
| France | 84 years | SPF |
| Germany | 82 years | RKI |
| Italy | 81 years | ISS |
| Spain | ~82 years | MDS |
| Sweden | 86 years | FOHM |
| Switzerland | 84 years | BAG |
| USA | ~80 years | CDC |

7) Hospitalization rate
Initial estimates based on Chinese data assumed a very high 20% hospitalization rate, which led to the strategy of ‘flattening the curve’ to avoid overburdening hospitals. However, population-based antibody studies (see above) have since shown that actual hospitalization rates are close to 1%, which is within the range of hospitalization rates for influenza (1 to 2%).
The US CDC found that Covid-19 hospitalization rates for people aged 65 and over are “within ranges of influenza hospitalization rates”, with rates slightly higher for people aged 18 to 64 and “much lower” (compared to influenza) for people under 18.
In local hotspots like New York City, the overall hospitalization rate based on antibody studies is about 2.5% (19.9% or 1.7 million people with antibodies and 43,000 hospitalizations by May 2).
The much lower than expected hospitalization rate may explain why most Covid-19 ‘field hospitals’ even in hard-hit countries like the US, the UK and China remained largely empty.
8) Percentage of Covid-19 deaths in care homes per country
In many countries, deaths in care homes account for 30 to 60% of all additional deaths. In Canada and some US states, care homes account for up to 80% of all “Covid19-related” deaths.

Source: Mortality associated with COVID-19 outbreaks in care homes (LTC Covid, May 3, 2020)

Source: The Covid-19 Nursing Home Crisis by The Numbers (Freopp, May 12, 2020)
9) Overall mortality
In countries like the US, the UK, and even Sweden (without a lockdown), overall mortality since the beginning of the year is in the range of a strong influenza season; in countries like Germany, Austria and Switzerland, overall mortality is in the range of a mild influenza season.

 vs. 1999 and 2020")

")
")
")
Sources: US, UK-1, UK-2, Sweden, Switzerland, Germany
10) Development of the epidemic
Even in countries without a lockdown, the epidemic reached its peak within a few weeks of the outbreak. However, many media showed cumulative deaths per day of report (left) instead of daily deaths per day of death (right), falsely implying an ever escalating situation.

Disclaimer
Some of the posts we share are controversial and we do not necessarily agree with them in the whole extend. Sometimes we agree with the content or part of it but we do not agree with the narration or language. Nevertheless we find them somehow interesting, valuable and/or informative or we share them, because we strongly believe in freedom of speech, free press and journalism. We strongly encourage you to have a critical approach to all the content, do your own research and analysis to build your own opinion.
We would be glad to have your feedback.
