In 2021, we were flooded with visuals showing us how effective the mRNA vaccines were against death from Covid. We saw, for example, that the Covid mortality graph of those who completed the 2-dose protocol was substantially lower than that of the unvaccinated. To strengthen the point, we were shown a consistent pattern across age groups or after age adjustment.
Much of this was an illusion. Back then, they did not display comparable graphs for non-Covid deaths. If they did, we would have seen that the vaccinated also fared better on non-Covid mortality. Of course, no one expects these vaccines to prevent death from cancer, heart disease, stroke, and so on.
The pseudo-effectiveness of Covid vaccines against death from unrelated causes is not a new observation. The same kind of pseudo-effectiveness was discovered long ago for the flu vaccines. It is called the “healthy vaccinee effect.” For various reasons, unrelated to the vaccines, people who are vaccinated have better background health (on average) than people who are not, and therefore, they are less likely to die from “anything,” including flu and Covid. Vaccinated or not, they would have had lower Covid mortality than their unvaccinated counterparts.
When we try to estimate the effect of Covid (or flu) vaccines, the healthy vaccinee effect becomes the healthy vaccinee bias, a source of distortion that must be removed. (Conversely, we may call it the “unhealthy unvaccinated” bias.) Research on this topic has been sparse, however. Neither the pharmaceutical industry nor public health officials have had an interest in discovering that common vaccines were not as effective as they claimed them to be, or perhaps not effective at all.
A recent study from the Czech Republic has made significant contributions to the scientific literature on Covid vaccines and the healthy vaccinee effect. First, the authors observed the phenomenon in another country, lending support to its universal nature. Second, they provide clear evidence that those who chose (or were coerced) to be vaccinated were indeed healthier. Third, they show that the phenomenon is consistent along the sequence of doses, as was evident in UK data for booster doses. Those who continued to the next dose were healthier than those who did not. Lastly, they demonstrate that the observed pattern in their data can be reproduced by simulated data when a vaccine has no effect and only the healthy vaccinee effect is operating. It is worth reading the paper in full, whether or not you are a scientist.
What was done in the study?
The authors computed rates of all-cause death in periods of Covid waves and in periods of low (almost no) Covid deaths. The latter are essentially rates of non-Covid death, which means that any “effect” of the Covid vaccines during these periods is a pseudo-effect. It is the healthy vaccinee phenomenon alone. In each period, they compared the mortality rate between the unvaccinated and various groups of vaccinated people.
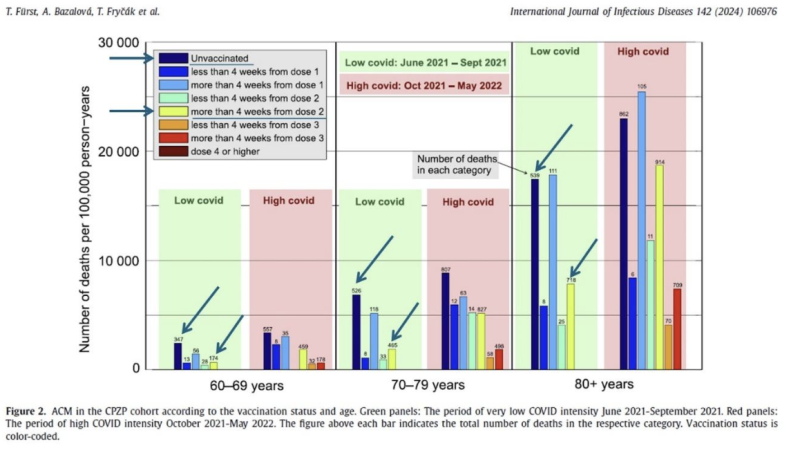
I will discuss one key topic: the pseudo-effect of the 2-dose protocol, starting four weeks after the second dose when people are considered fully protected. To focus on that group versus the unvaccinated, I added oblique arrows to Figure 2. Notice that these bars show rates, not counts, of deaths in a period with low Covid deaths (green panel). Again, although these are deaths from any cause, 99.7% were not related to Covid. Therefore, they may be considered rates of non-Covid death, and that’s what I will call them.

In each age group, the rate of non-Covid death in the effectively vaccinated (yellow) is much lower than the rate in the unvaccinated (black). Of course, that’s a pseudo-effect of the vaccines. That’s the healthy vaccinee effect, or bias when trying to estimate the true effectiveness against Covid death.
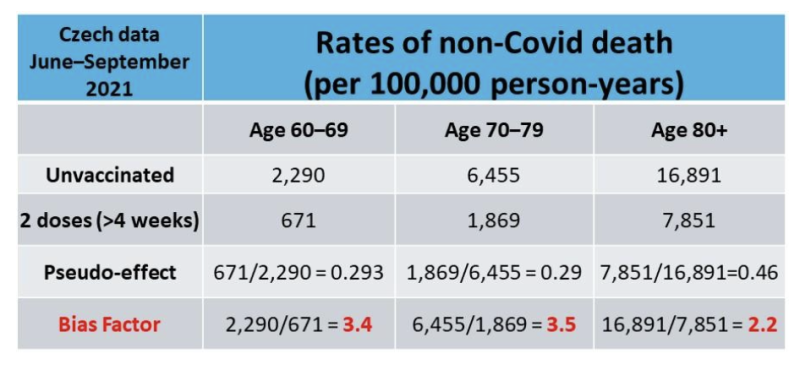
The authors kindly provided their data, which is summarized in my table for the low-Covid period.

As you can see from the computation, the “bias factor” (last row) is simply the inverse of the pseudo-effect of vaccination. It tells us how much more likely the unvaccinated are to die “in general,” as compared with those who completed the 2-dose protocol at least 4 weeks earlier. Formally, it should be called the bias correction factor, but we’ll keep it short.
My next table compares the results from the Czech Republic to data from the UK and the US in similar age groups (my computation from the available data).

Notably, the bias factor in data from different countries and cultures varies in a narrow range: between 2 and 3.5. It is lower in the oldest age group but is still at least 2. Overall, the unvaccinated are two to three times more likely to die from various causes than the fully vaccinated.
Other data indicate that the gap narrowed over time (because unvaccinated survivors were “healthier” as time went on and some of the less healthy died), but it lasted months, not a few weeks. When a third dose was introduced, the healthier moved to the three-dose group, leaving behind a sicker group of “only two doses.” As a result, the two-dose group now appeared to have higher mortality than the unvaccinated. This observation was mistakenly interpreted as evidence of vaccine-related deaths (which unquestionably happened).
To remove the healthy vaccinee bias, we multiply the biased rate ratio of Covid death by the bias factor, as explained elsewhere. For example, if the biased rate ratio of Covid death is 0.4 (60% “vaccine effectiveness”) and the bias factor is 2.5, the correct effect on Covid death is 0.4 x 2.5 = 1, which is 0% vaccine effectiveness.
(Those with math insight will recognize that the correction may also be computed as follows: the biased rate ratio of Covid death divided by the biased rate ratio of non-Covid death.)
I will conclude with another example of the healthy vaccinee bias and the true effectiveness after correction.
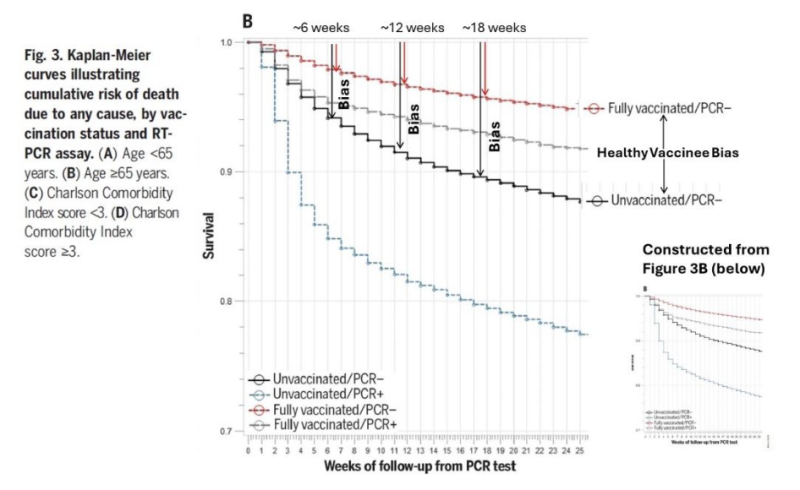
A study of US veterans presented survival graphs of fully vaccinated and unvaccinated elderly people following a PCR test (figure below). I will consider a death following a positive PCR as “Covid death” and a death following a negative PCR as “non-Covid death.” It is just an approximation, of course, but that’s all we can get from the paper to distinguish between the two types of death. Studies of Covid vaccines rarely report data on non-Covid death by vaccination status, so we often have to derive such data from whatever is provided.

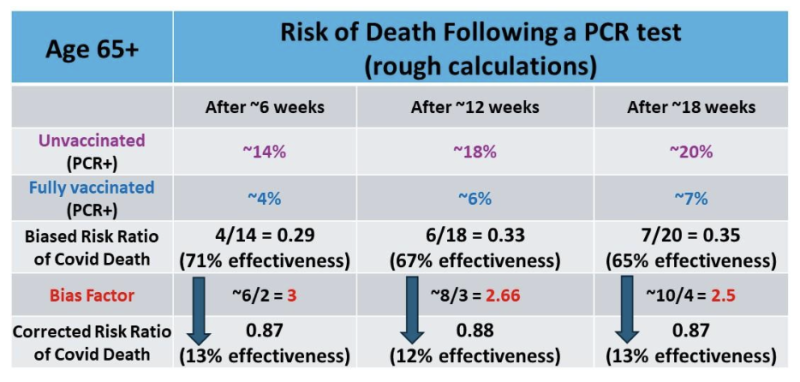
I visually estimated the risk of death at three time points, where the survival probabilities for a pairwise comparison were close to the marks on the Y-axis (2% intervals). My rough estimates are summarized in the busy table below.

As you can see, correcting for the healthy vaccinee bias has changed estimates of effectiveness from around 70% to around 10%. And that’s not the only bias in observational studies of Covid vaccines. Differential misclassification of the cause of death is another strong bias. Would any effectiveness have remained if all the biases could have been removed? Were lives indeed saved by these vaccines?
Let me end with a comment not on Covid vaccines, but on flu vaccines.
If you look at the US CDC website, you will find data on the effectiveness of the flu shot each year. Usually, it does not exceed 50% in the elderly (a risk ratio of 0.5). By now, you should be able to compute the correct effectiveness, say, with a bias factor of 2.
Disclaimer
Some of the posts we share are controversial and we do not necessarily agree with them in the whole extend. Sometimes we agree with the content or part of it but we do not agree with the narration or language. Nevertheless we find them somehow interesting, valuable and/or informative or we share them, because we strongly believe in freedom of speech, free press and journalism. We strongly encourage you to have a critical approach to all the content, do your own research and analysis to build your own opinion.
We would be glad to have your feedback.
Source: Brownstone Institute Read the original article here: https://brownstone.org/

