
After Donald Trump’s succession of early primary victories, and Nikki Haley’s stinging loss in Nevada on Tuesday, a Biden-Trump rematch seems all but inevitable come November. The outcome of that contest, however, is far from certain.
According to most accounts, Biden’s campaign is starting to falter, with Trump maintaining a slight edge in the national polls. But anyone tempted to write off Biden should do so with caution. As a new Focaldata-UnHerd poll of six key swing states reveals, the race for the White House is much closer than the headlines suggest.
We find that:
- Trump has only a very small lead across the swing states.
- Biden has a hidden advantage as the incumbent.
- There’s a possibility of a polling error against the Democrats.
- Key battleground issues are yet to be won.
The state of the swing states
We ran separate state polls in each of America’s six key swing states. The first group was Michigan, Pennsylvania and Wisconsin — the “rust belt” that swung for Trump in 2016, but went blue again for Biden in 2020. We also polled Arizona, Georgia and Nevada, the first two of which were edged by the Democrats in 2020 — for the first time since Bill Clinton. Nevada has been more reliably Democrat but remains an extremely close competition.
On the surface, the results from our polls show that Trump has a lead in all six states. He is just 2 points ahead in Michigan, and as many as 9 in Georgia — but a lot of small-to-medium leads add up to a strong advantage overall.
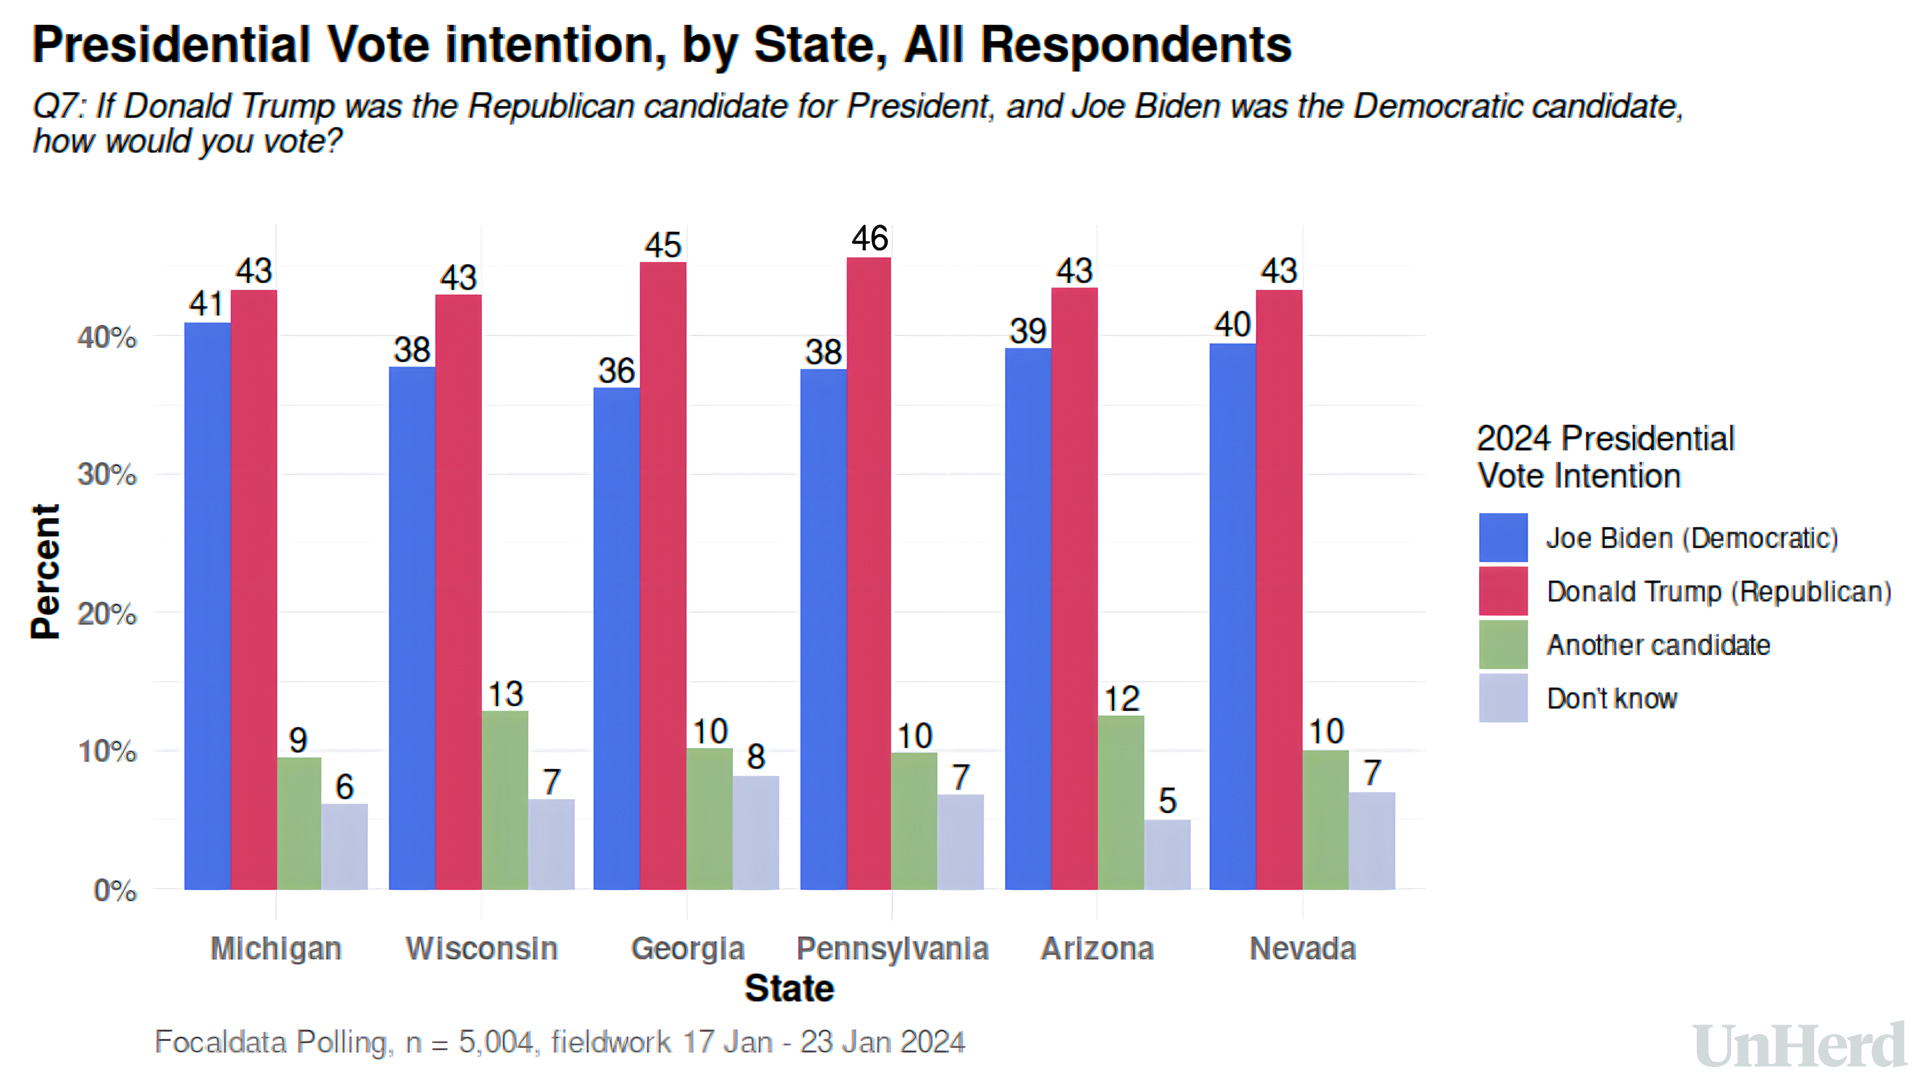
However, when we focus on people who are likely to vote, things narrow significantly. Trump is still well ahead in Georgia — the closest state in 2020 — but his lead in the other states has shrunk. Biden even edges ahead in Michigan.
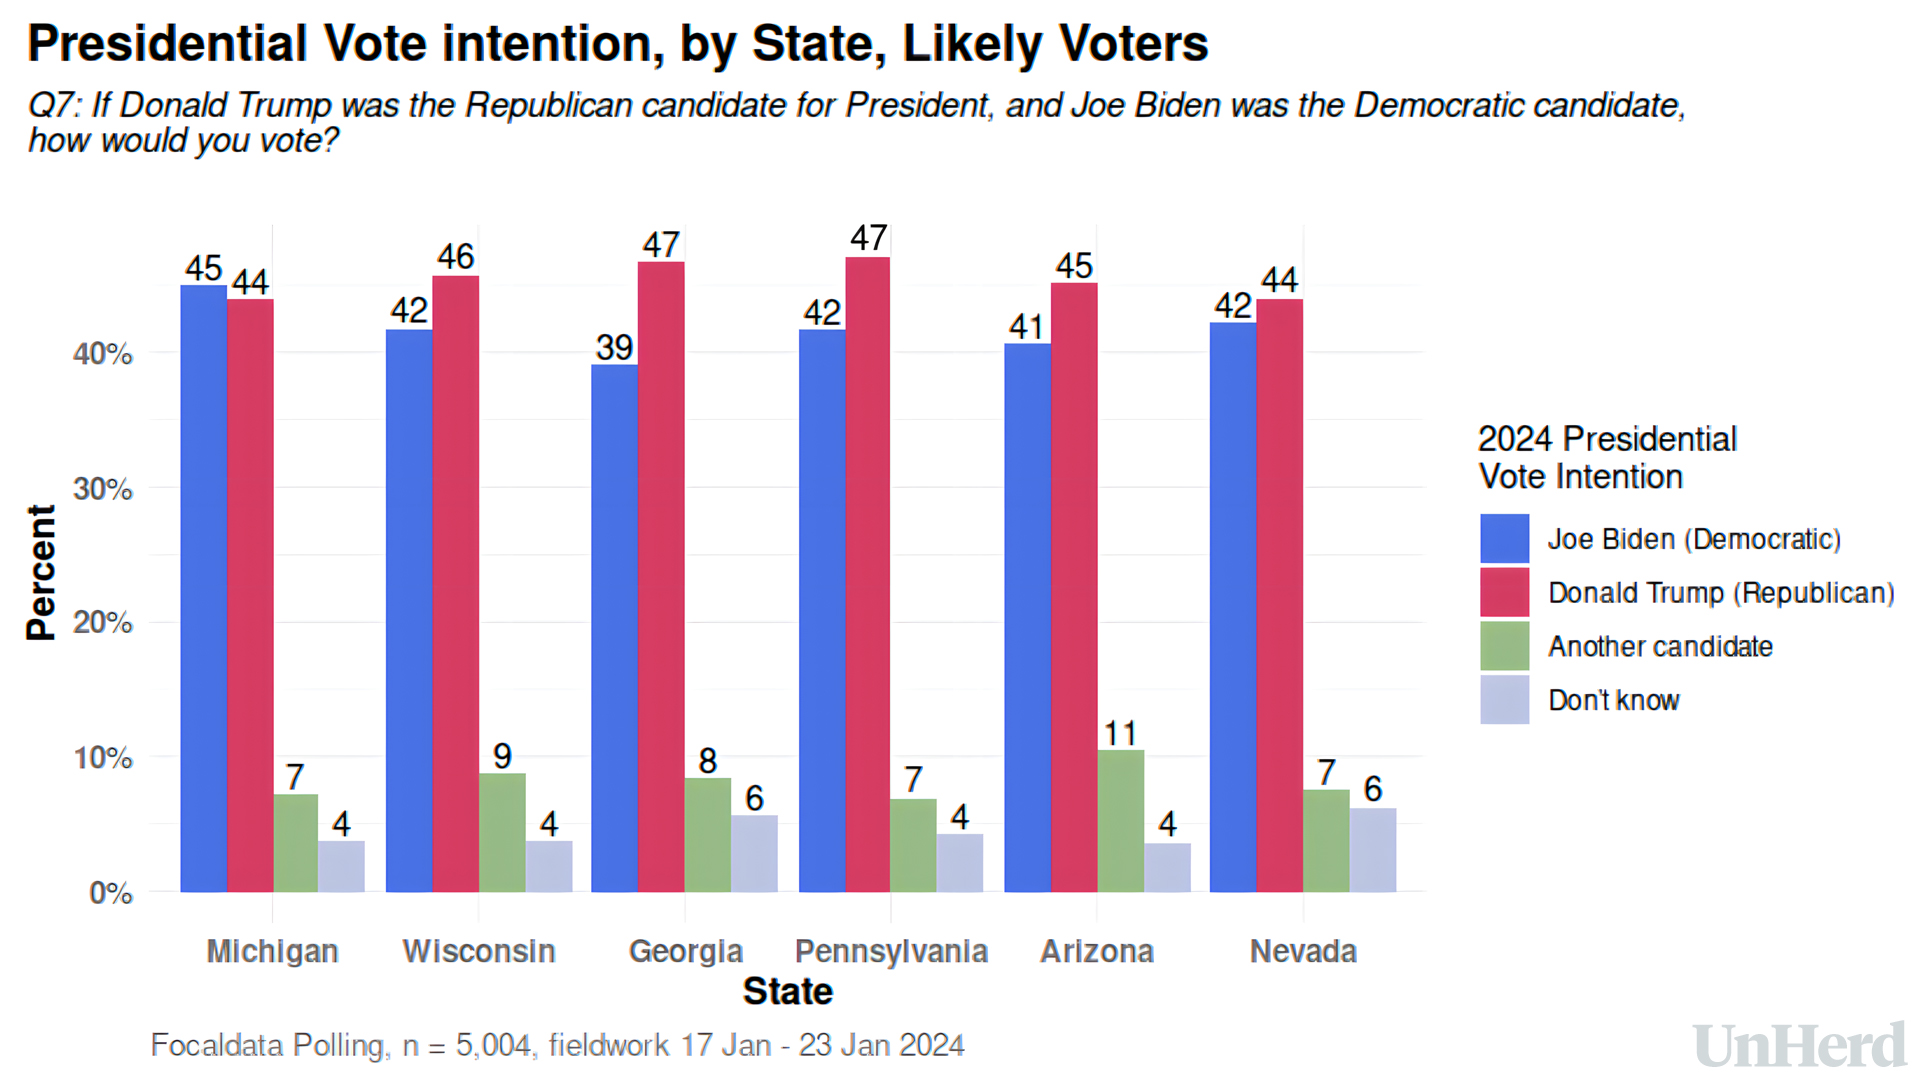
Most obviously, this shift reflects Trump’s popularity among politically disengaged groups who are less likely to turn out to vote in November. It leaves the former president with the challenge of motivating these people to show up: can he recapture the enthusiasm of 2016?
Adding further uncertainty is the fact that a large percentage of respondents — 11-15%, depending on the state, which is enough to swing the election — favour another candidate, or say they “don’t know” how they will vote. This far out from November, that’s normal — but how will it change in the coming months?
To find out, we asked these people a follow-up question: “Although you do not intend to vote for Donald Trump or Joe Biden, which of the two do you lean towards, even if only a little?” The results were striking.
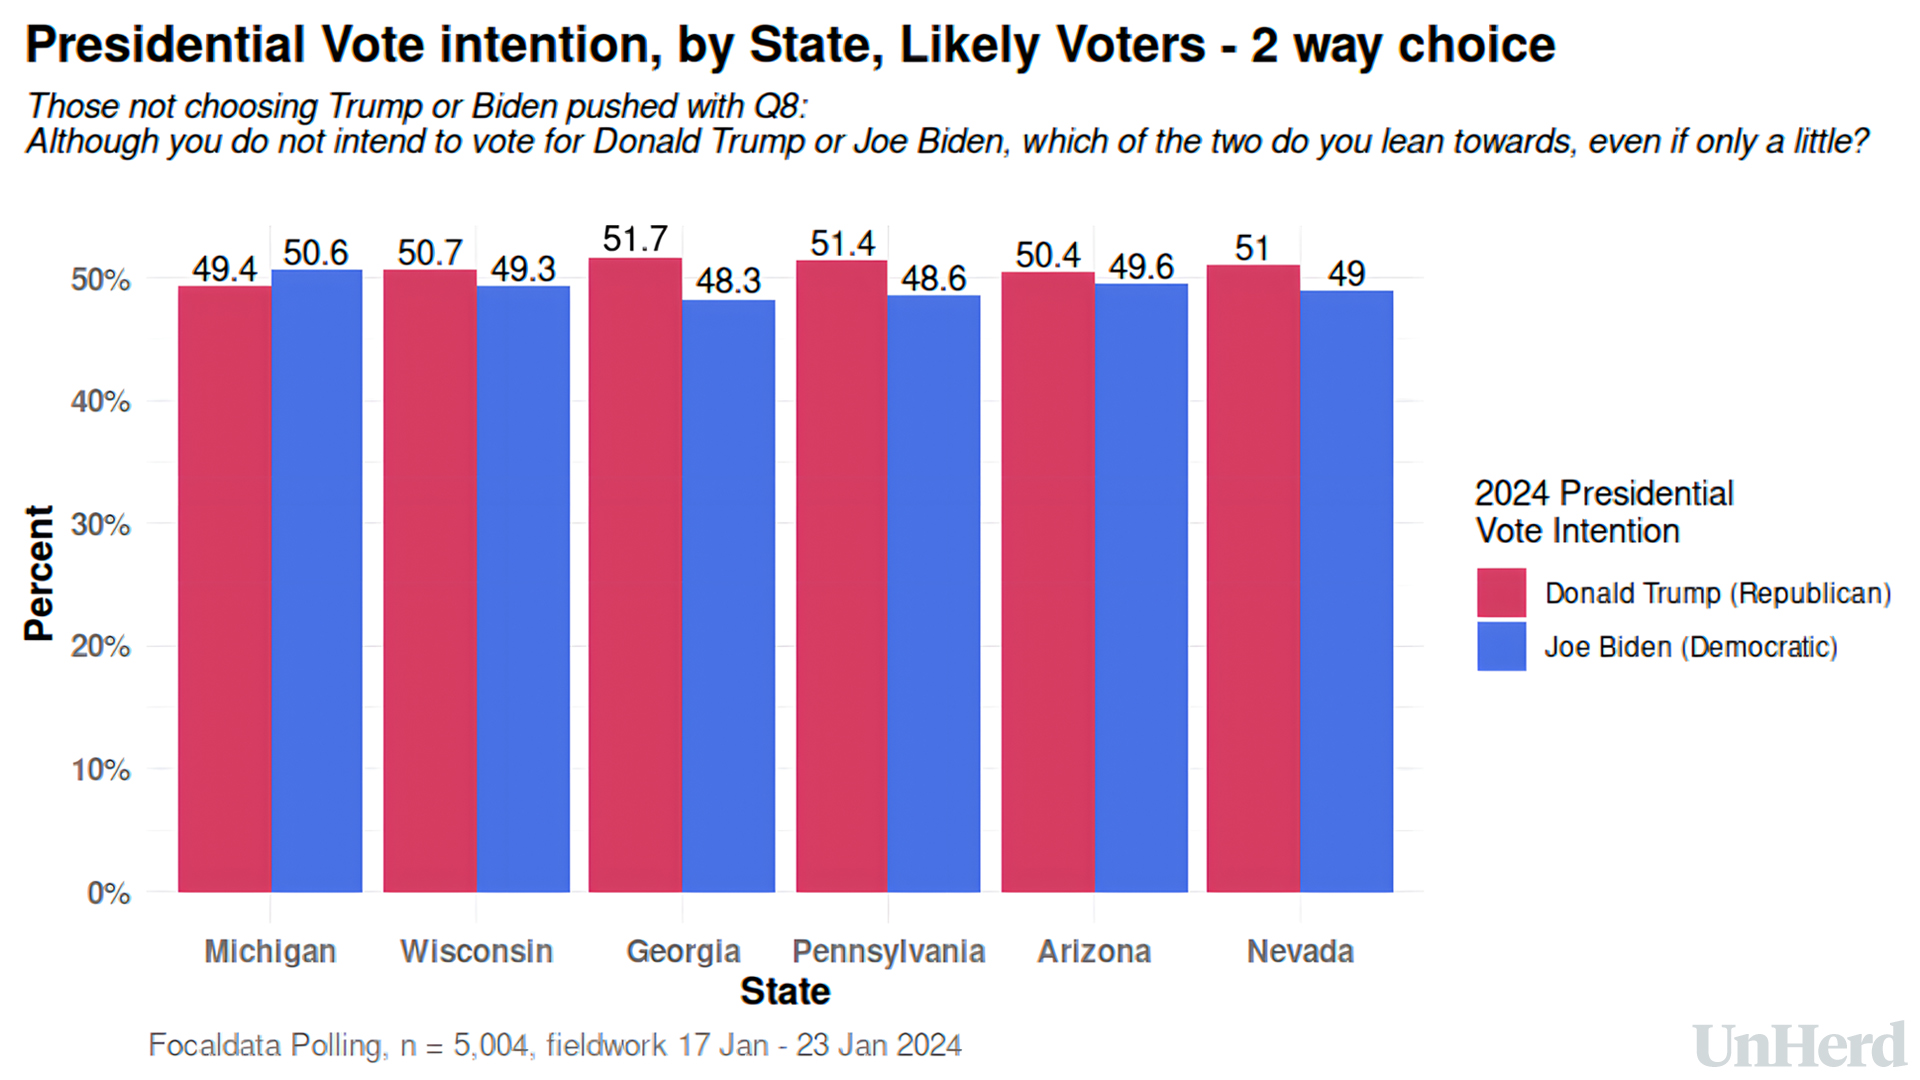
When we combine these responses with the Trump/Biden choices of other likely voters, the election looks much closer. Trump’s lead is now 2 points or less in Wisconsin, Arizona and Nevada, and just 3 points in Georgia and Pennsylvania. We think that this is closest to the real “state of play” in each of the swing states: Trump is only marginally ahead.
Of course, the presidency is not only about voter percentages; it’s about the electoral college, too. Hillary Clinton and Al Gore both won the popular vote, but not the keys to the White House. And this time, the maths is against the Democrats. In other words, Biden could easily have a very good campaign and still lose.
Some of the six states are worth more than others. Pennsylvania, in particular, is worth more electoral college votes than Arizona and Nevada combined. Given how very close Georgia was last time (Biden won by just 0.23%), we might well expect him to lose it this year. That, however, makes Pennsylvania the key swing state. Even if Biden wins Wisconsin, Nevada, Arizona, and Michigan, he would still lose overall (by 270 to 268).
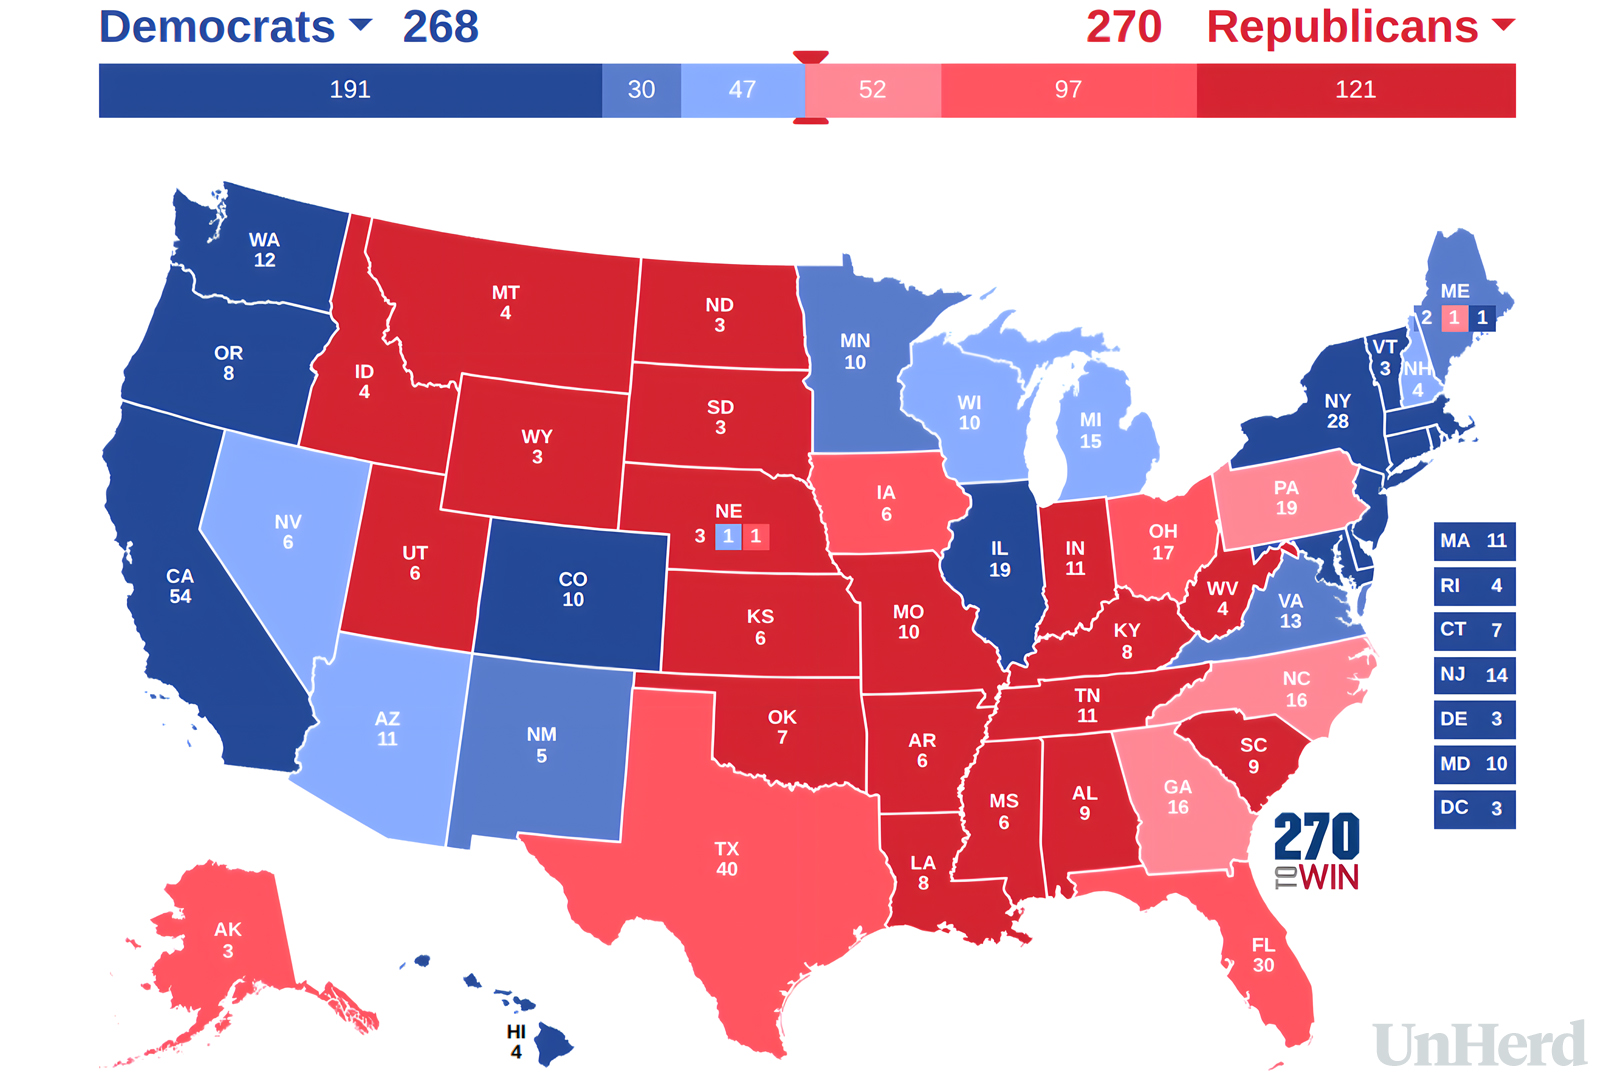
This particular map, where Trump flips only Georgia and Pennsylvania, is fascinating. Trump would win by 270-268, but it’s close enough to be decided by the changes in electoral college vote allocation since 2020, when Biden would have won with this configuration. What’s more, Maine’s attempt to bar Trump from the ballot would become relevant: if that were upheld by the courts, Trump would lose one vote to Biden, tying the electoral college.
It’s extremely difficult to put a hard number on things, but taking the only-Biden-or-Trump figures above as a baseline, and accounting for expected polling error, we would say that Trump probably can count on a 90% win rate with the polls where they are. However, things are close enough that if there were to be just a 1.3% swing to the Democrats, Biden would be favourite.
If history is our guide, then a 1.3% swing is hardly inconceivable. Since Reagan was inaugurated in 1981, incumbent presidents have increased in the polls by an average of 1.75% from January to election day. Moreover, once you exclude the mad 1992 election, in which Ross Perot took nearly 19% of the vote, and incumbent George H. W. Bush lost 7% during those months, the average incumbency pickup is 3.75%.
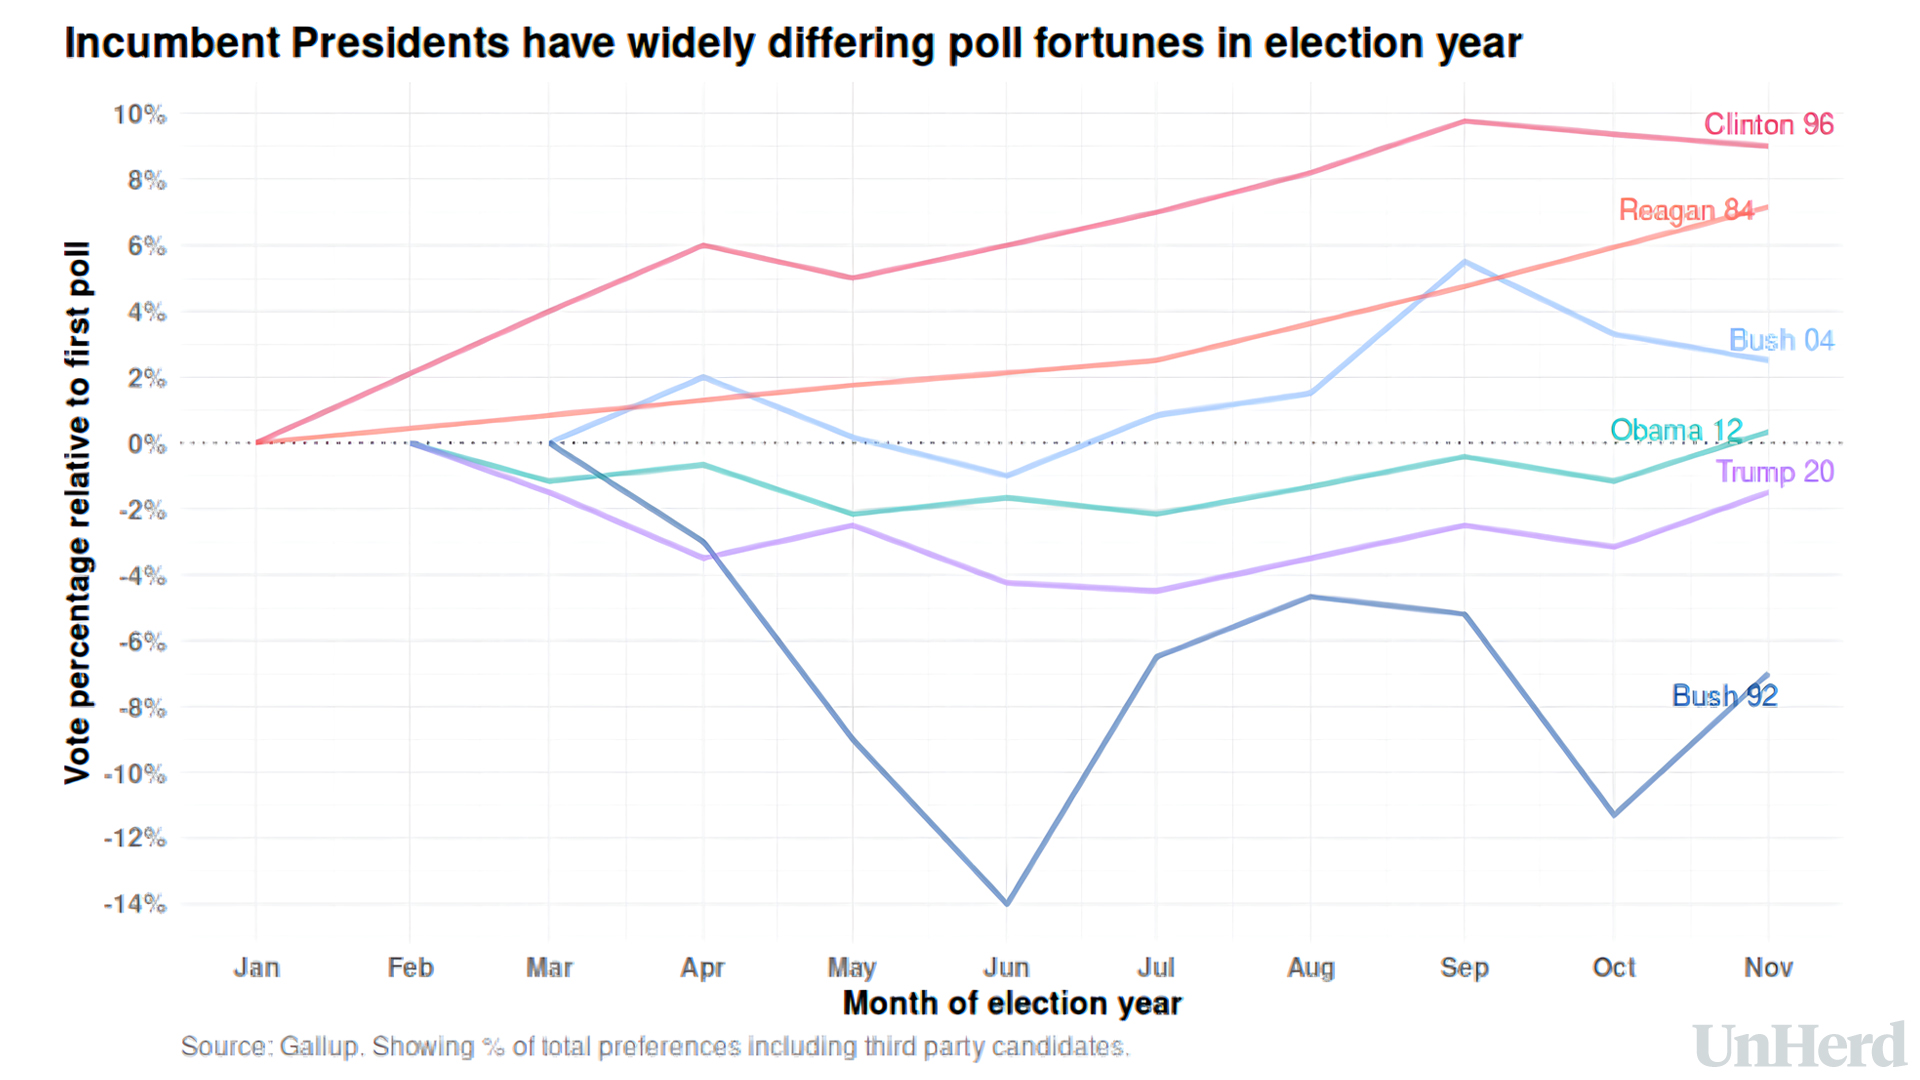
Of course, this all depends on the scenario. Will Biden’s campaign follow Obama’s in 2012, when he broadly didn’t pick up any votes from February onwards? Or will it resemble Trump’s in 2020, when he actually lost votes towards election day? If the latter, Trump 2024 is still the heavy favourite.
Indeed, that 3.75% average is heavily tilted towards the massive incumbency gains made by Reagan in 1984 (7%), and Clinton in 1996 (9%), two of the greatest orators of the 20th century. Is that really replicable? When you step back, this election surely has more in common with George W. Bush’s in 2004, which resulted in a modest 2.5% pickup. And if that does happen, it could result in the closest electoral college map in history, with constitutional chaos bound to follow.
It’s going to be a defensive election for the Democrats. Biden, who represented a “fresh start” in 2020, is now feeling the costs of governing. The problem for Democrats is that the last election was very close — Biden won by less than a single percentage point in Arizona, Wisconsin and Georgia. And he can’t afford to lose them now.
That said, presidential vote choice now tends to be extremely static. Gone are the days when a large percentage of the electorate were genuinely prepared to vote for either of the two main parties. Over 90% of Republican and Democratic voters in 2016 voted for the same party in 2020. It suggests that this year’s election will be decided by turnout rather than switchers: just 3% of those we surveyed are intending to directly switch from Trump to Biden.
The question is: of those who voted Biden in 2020, how many are not planning to vote for him this time? We used a regression model — a way of teasing out what drives voting behaviour using statistical analysis, rather than explicit answers, as people are not very good judges of their own motivations and impulses. The results were pretty striking.
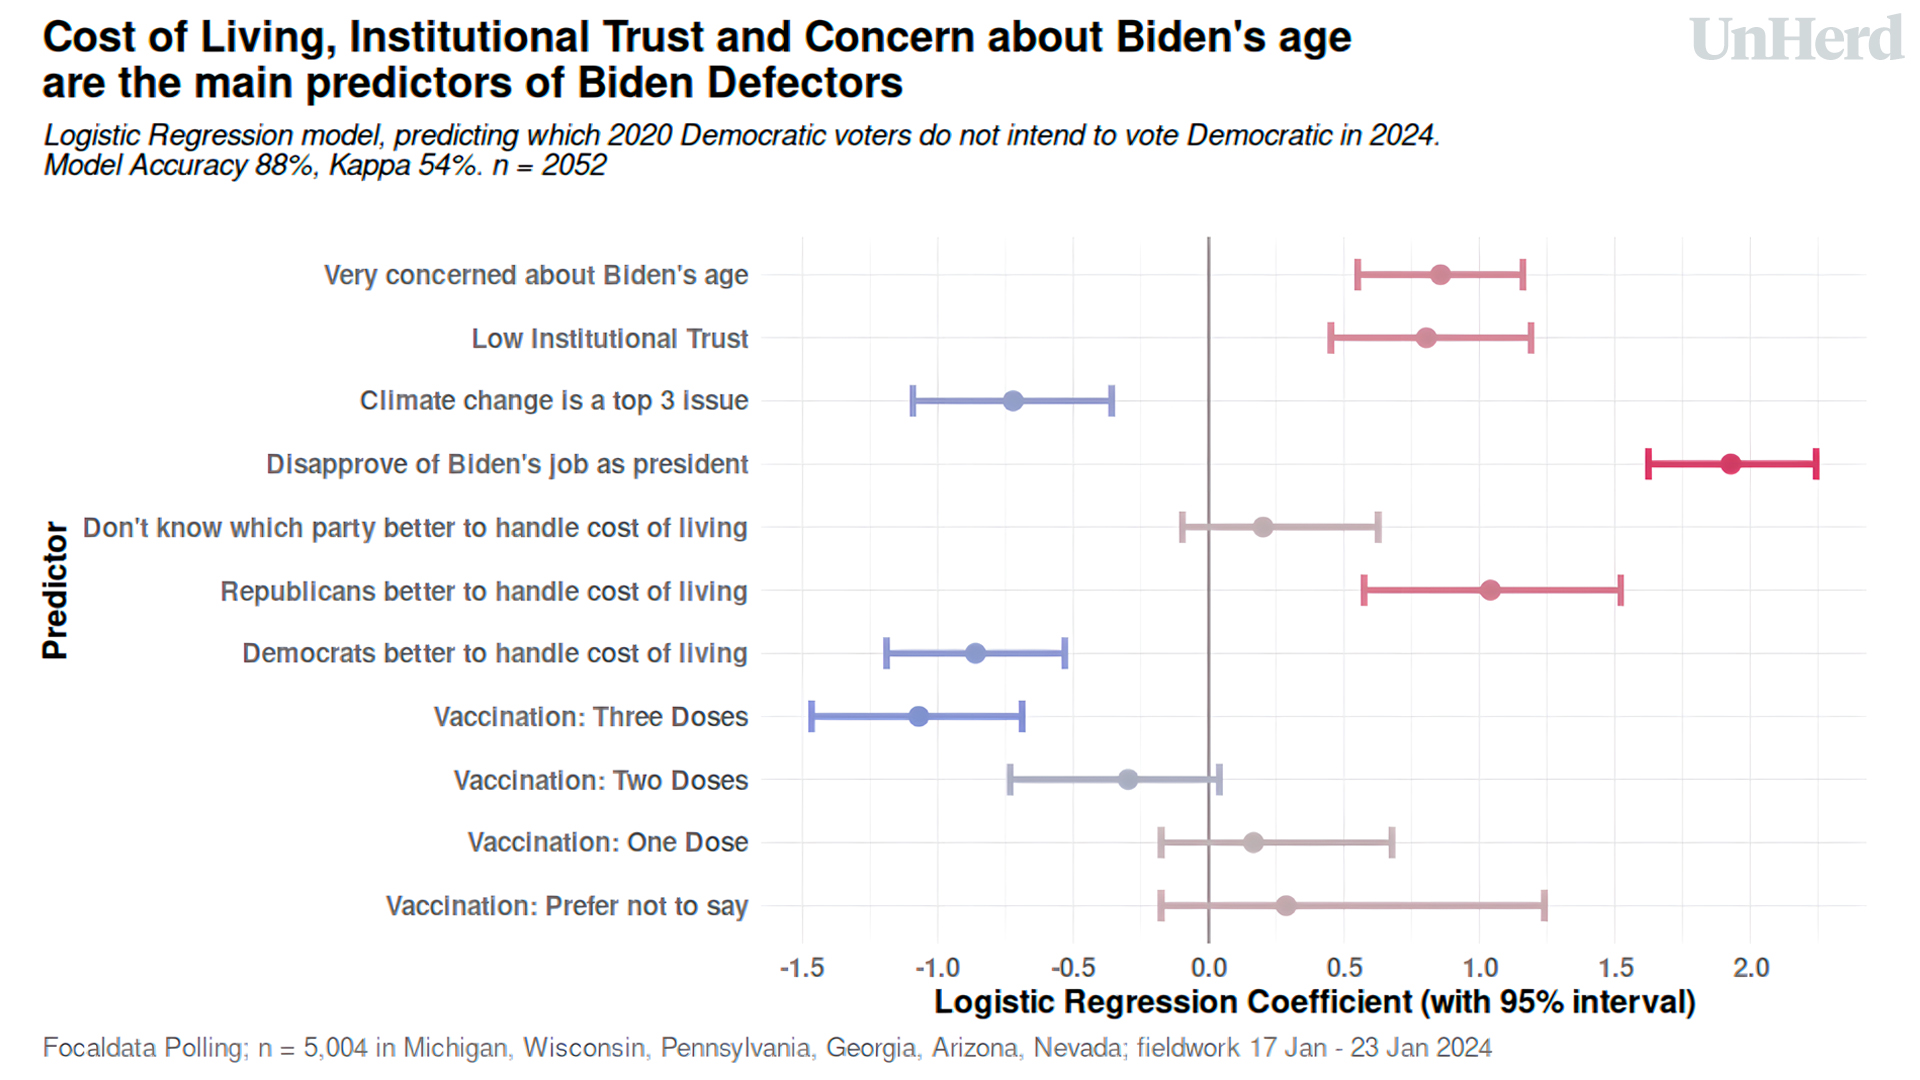
The biggest factor behind defection from voting Democrat is, unsurprisingly, people’s approval of Biden as President. The next three factors are: belief that Republicans can handle cost of living better, high concern about Biden’s age, and low institutional trust.
There are, however, also blockers that stop people from defecting: Biden’s decision to make climate change a top-three issue, and a high level of trust, as measured by Covid vaccination doses (more on this below).
There is a lot of collinearity here: those who rate Biden poorly are also very likely to think that Republicans will better handle the cost of living. But the overall message is that it’s a very personal election: people are not voting for Biden because they don’t think he’s done a good job when it comes to the cost of living. Reversing this is key.
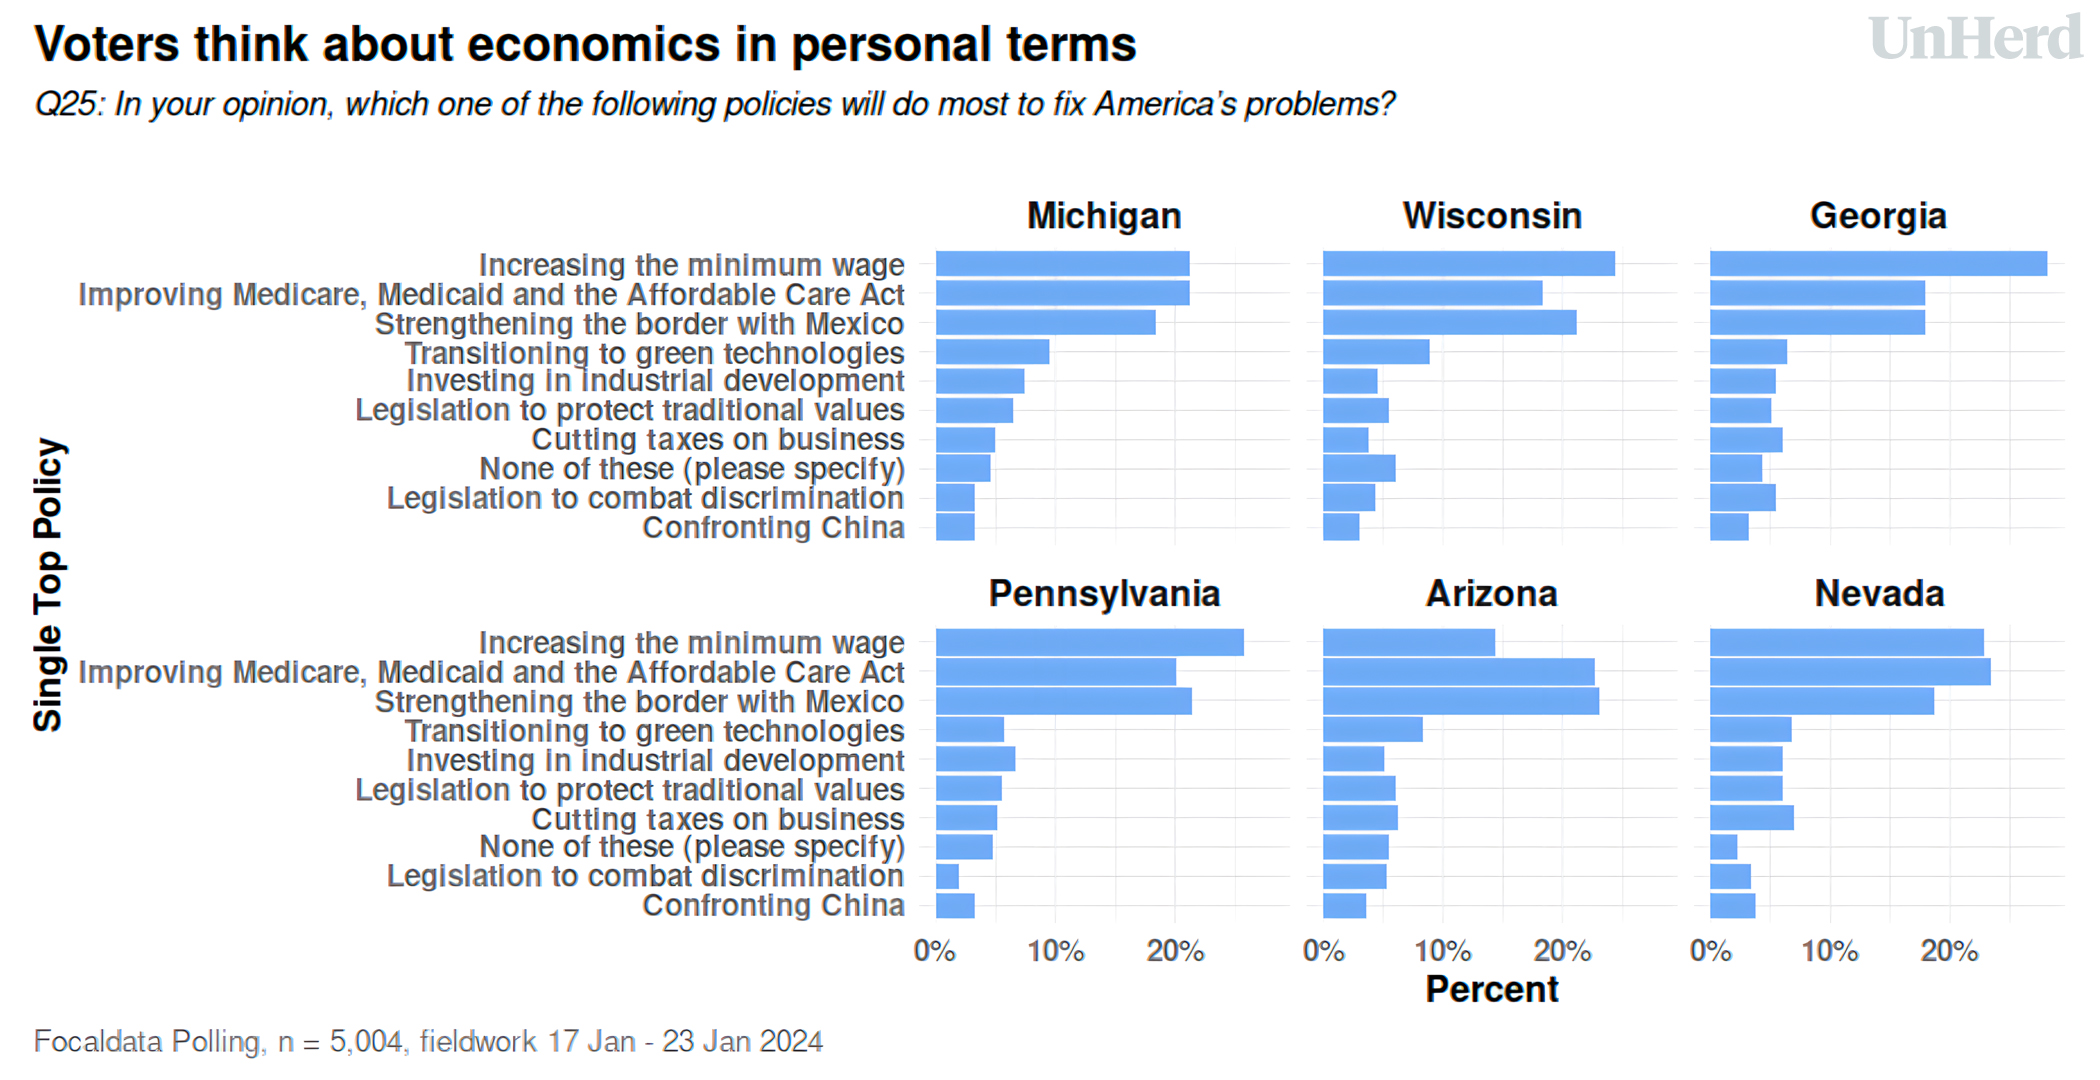
And this is where things get tricky for Biden. For while his flagship policies involve investment in the economy, voters do not associate these policies with the cost of living. Half of respondents (51%) picked the cost of living among their top-three issues in our poll, almost 20% more than the next most important issues, immigration and healthcare. However, when respondents were prompted to pick a policy, they chose direct income — a higher minimum wage, or improving the Affordable Care Act — over industrial or green investment, by a large margin.
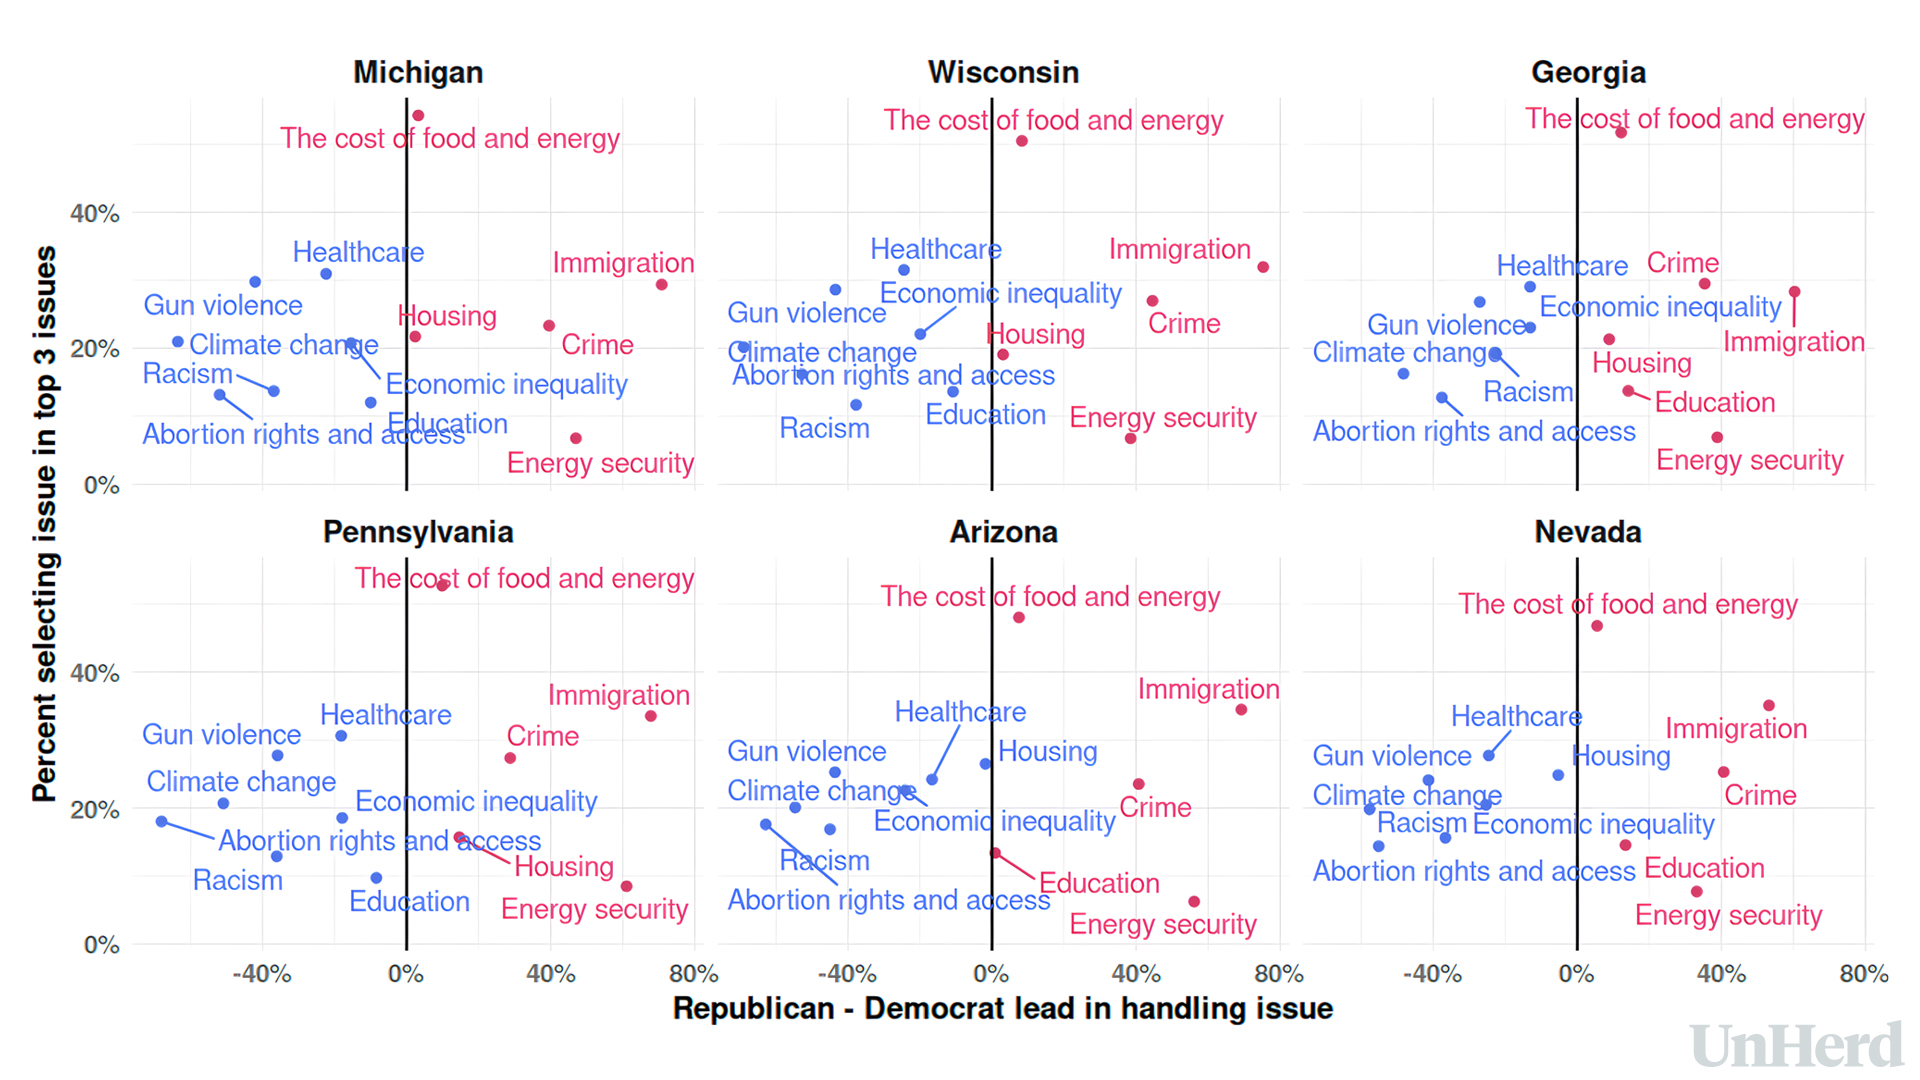
But before we get too bearish on Biden, it’s worth looking at the battleground maps. In any given election, looking at these quadrants is a staple activity of the war room. Each graph shows the salience of each issue — and which party is winning it. But as those below indicate, this election is a dog-fight, and it’s probably going to remain so right up to election day.
For people like us who spend their day poring over political polling, the 2016 election night looms large in polling nightmares. The polling industry as a whole failed to pick up the extent of Trump’s support, and there was a large polling “miss” on a state level, as Trump unexpectedly won in a number of Democratic states — in particular, Michigan and Pennsylvania. Could that happen again?
For all the excitement, we don’t think such a big miss is likely. Since Trump and Biden have run against each other before, the overall pattern of their support is mostly a “known quantity”, unlike in 2016. There are, however, some signs that controlling for education — one of the key factors in the 2016 election surprise — may no longer be enough. This increases the possibility of a slight polling error — but this time against the Democrats.
Since at least 2000, the Democratic-Republican political divide has been moving away from income and “realigning” towards trust in the federal government and mainstream media. Poorer areas with high levels of suspicion towards the state have been shifting from Democratic to Republican, while wealthier and educated areas have become increasingly Democratic.
A key measure of this shift are Covid-19 vaccination rates. Many people in the US chose not to be vaccinated, or did not take at least one of the recommended doses. This choice was strongly linked to their trust in the government, media and scientists. The fact that vaccination data is available for relatively small geographical areas makes it an ideal tool to investigate how important “trust” is to politics.
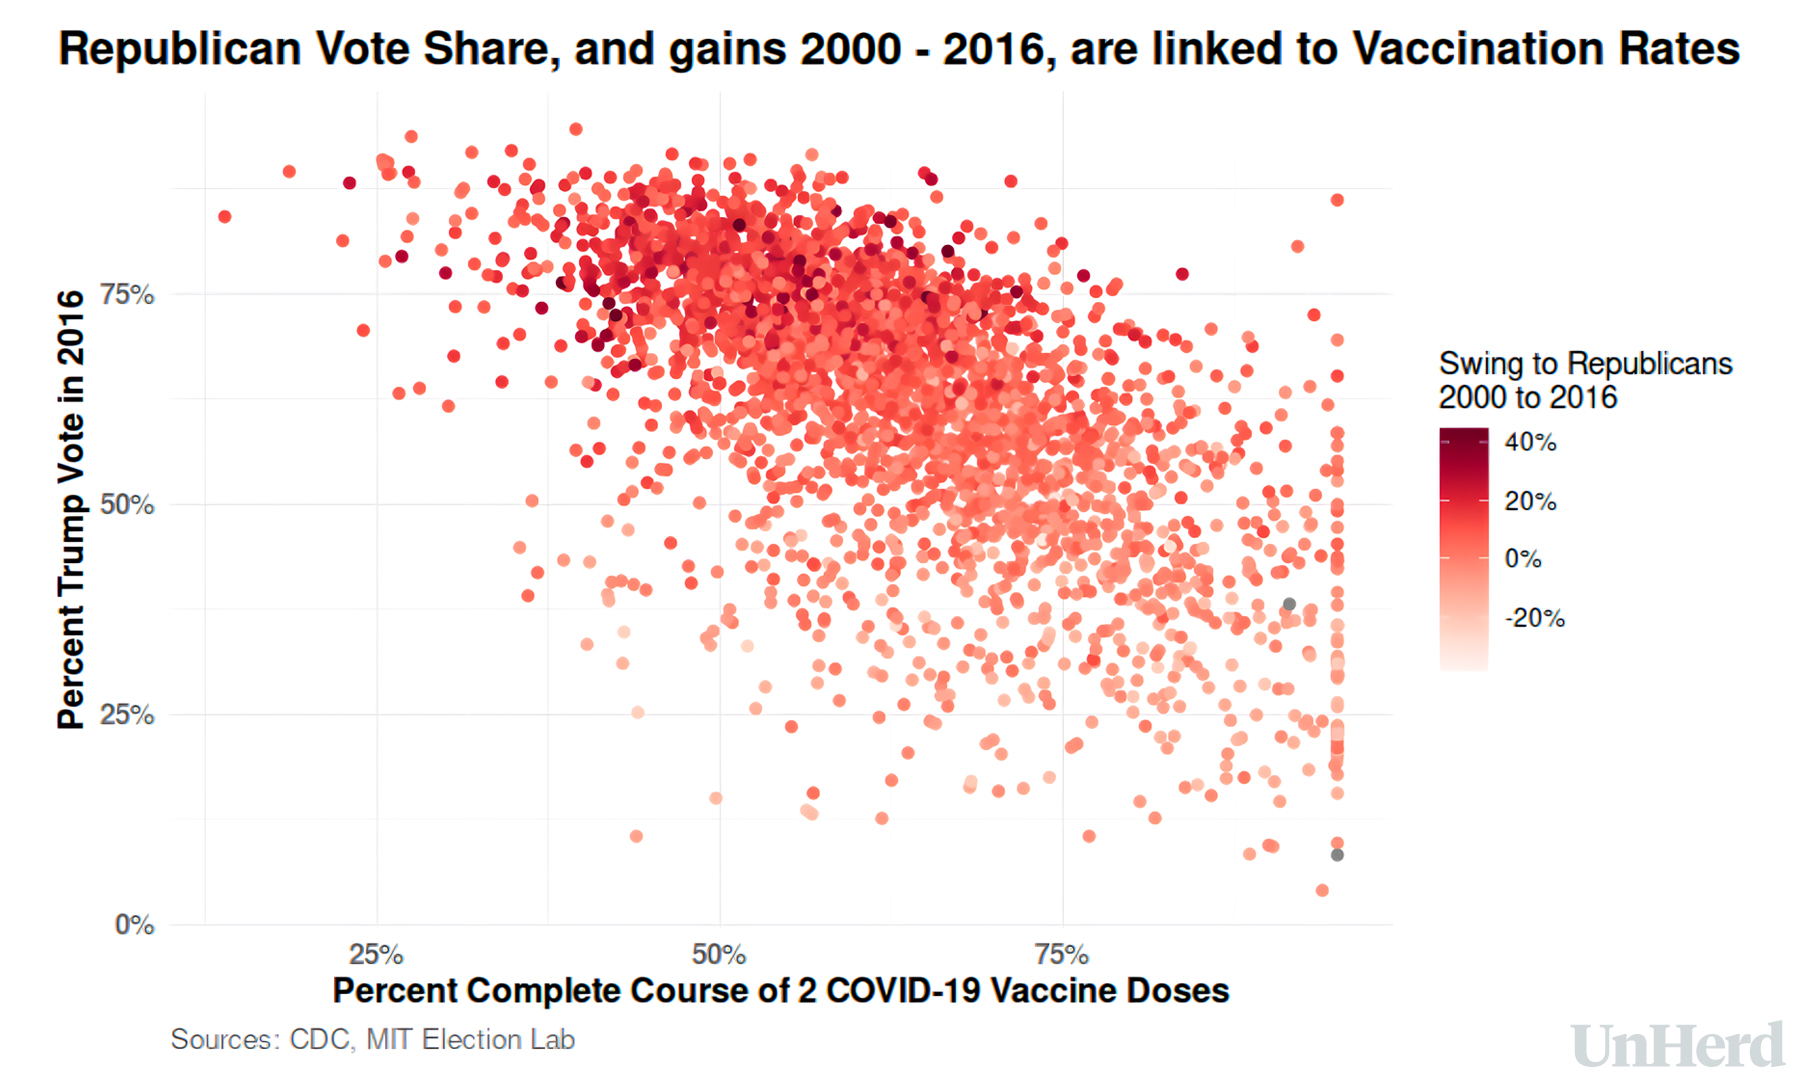
As the above graph reveals, trust is extremely important in understanding the shift in Republican support since 2000. The correlation between Trump’s vote in 2016 and the percentage who completed the initial course of two doses is strong (at -0.62), as is the correlation to Republican gain between 2000 and 2016 (-0.46). Note: this is the Republican vote share from 2016 — vaccination rates are used to track underlying social attitudes, rather than opinions relating to Trump’s handling of the pandemic.
What vaccination rates give us is a granular variable that isn’t strictly demographic, but is in fact quite predictive of your cultural outlook and values. It helps us understand when a poll may be demographically balanced — i.e. have the right number of white people aged 18-24 — but not representative of other politically sensitive variables — i.e. it has too many unvaccinated people or not enough two-dose Americans. When this happens you get a polling error. In the case of our own, we found that panel data typically overestimated unvaccinated, and underestimated two-dose Americans — thereby potentially underestimating the Democrat vote share.
Added to this factor is the possible existence of “non-response bias”, a result of the skew caused by certain kinds of people being more likely to answer surveys than others. In the US, the hardest to reach respondents tend to be the youngest (18-24) as well as those aged 65 and over. In surveys these groups are often represented by a particular subset who are more likely to answer surveys: namely, the 18-24s who use social media most heavily, and the most educated retirees.
This probably skews the results for those groups, making the youngest groups appear more Republican, and the oldest too Democrat. We think this is behind many polls showing Trump leading Biden among voters aged under 30 — something Sabato’s Crystal Ball has noticed. Although Trump has probably gained among this group since 2020, it would be very surprising if he had gone as far as to overturn Biden’s lead. We think that the age cross breaks of US polling are deeply vulnerable to polling error and data quality. We are sceptical that the age curve of the US has flattened to the degree the polls suggest.
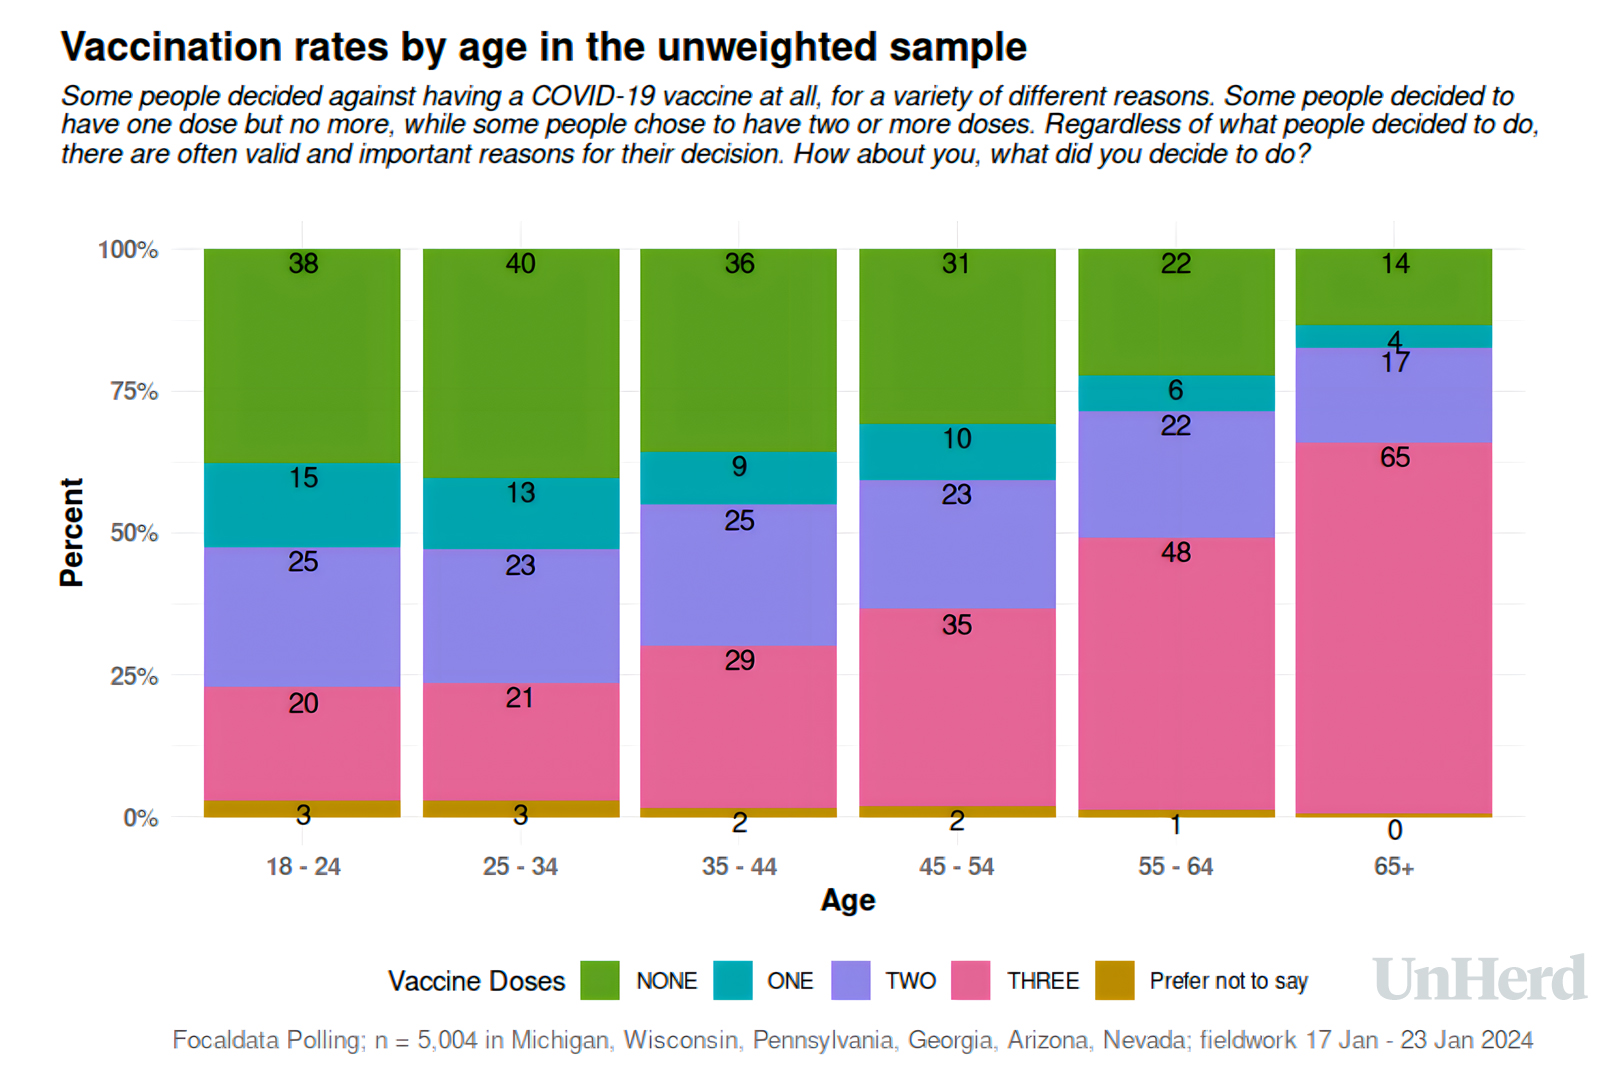
A similar effect, in reverse, may also be leading pollsters to overestimate Democratic support among the over-65s. To make matters thornier, this skew can interact with the vaccination angle. In our raw sample, unvaccinated 18-24s are overrepresented: just half have received two doses, a figure that should be closer to two-thirds. With high-dose young Democrats being less represented in polls, and authoritarian, unvaccinated young adults more represented — it is clear that the young are very likely to be less pro-Trump than polls suggest, and older voters marginally more supportive of Trump than public polls.
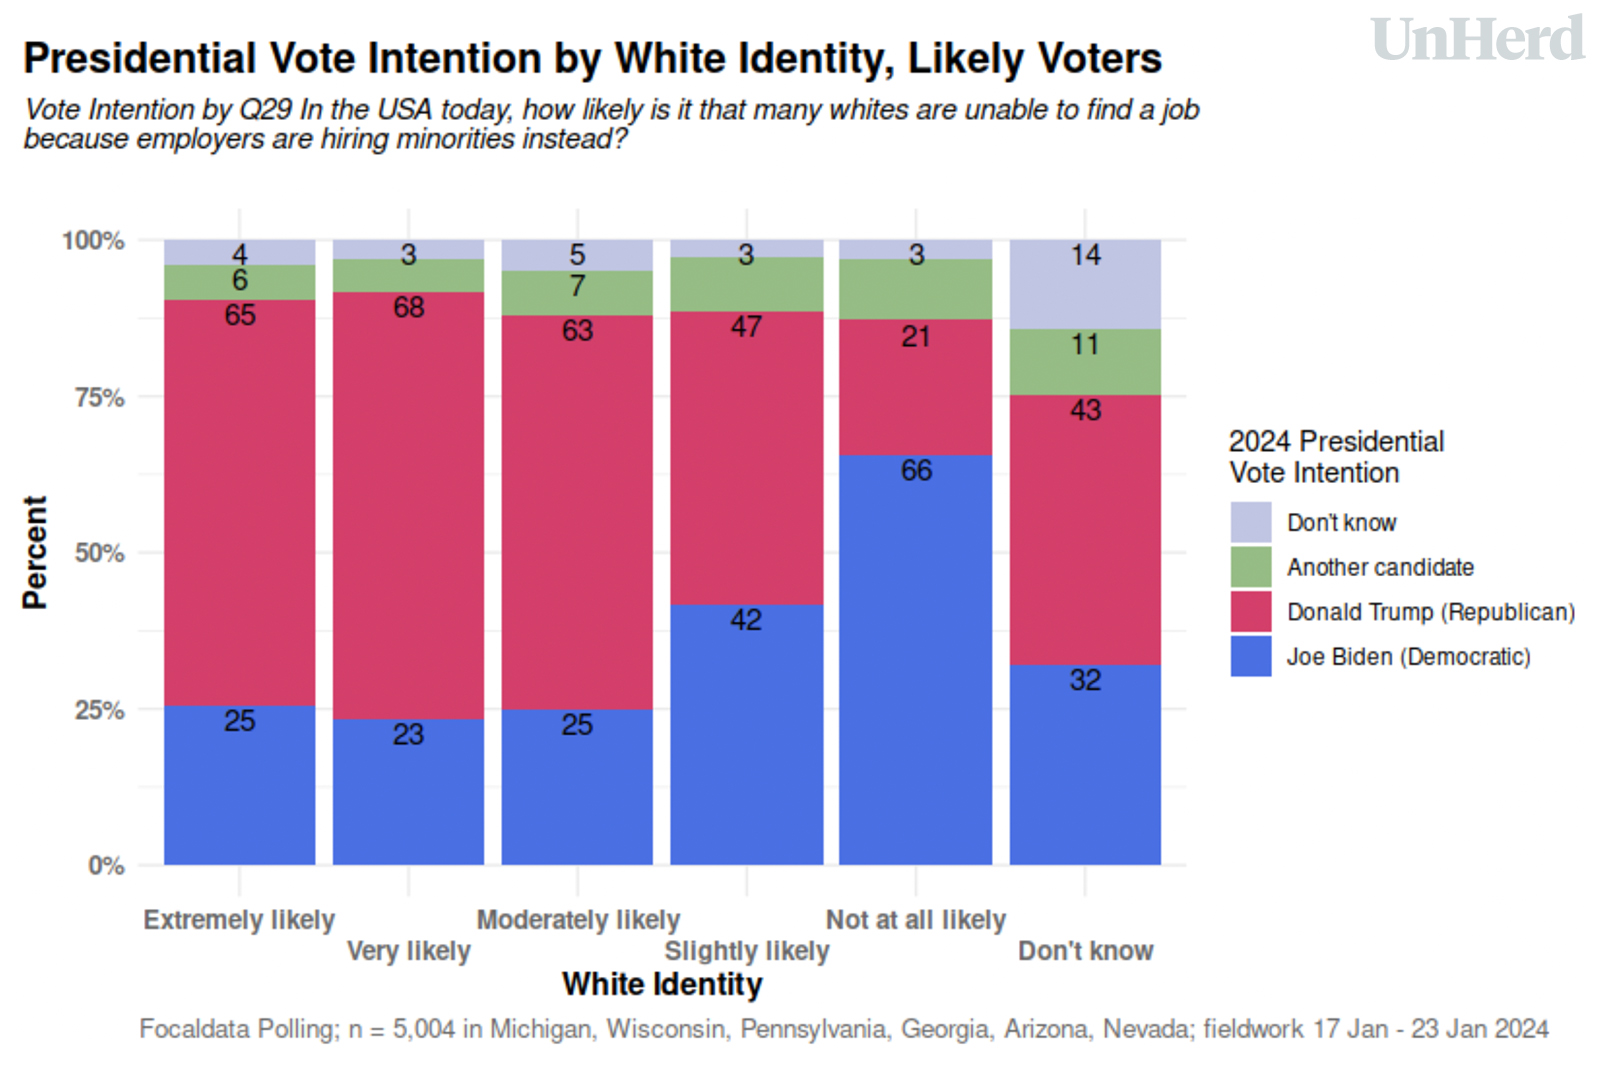
Another aspect of our polling we’ve been looking at is “white identity” — or specifically, the belief that there is discrimination against white Americans. In this survey, we measured this by asking: “In the USA today, how likely is it that many whites are unable to find a job because employers are hiring minorities instead?” The most common response was “Not at all likely” — but responding positively to any extent is a strong predictor of voting for Trump, both in 2016 and 2020.
What’s really interesting here, however, is that polls may be overestimating the percentage of people — particularly white people — who are hostile to affirmative action, and who believe their job prospects are hindered by minorities. If that’s the case, then we might expect a very different kind of polling error this cycle. When we look at the incidence in our survey compared to those in the general population (as measured by the ANES 2020 survey), we are over-sampling those who answer “extremely” and “very likely” (and particularly so in Pennsylvania).
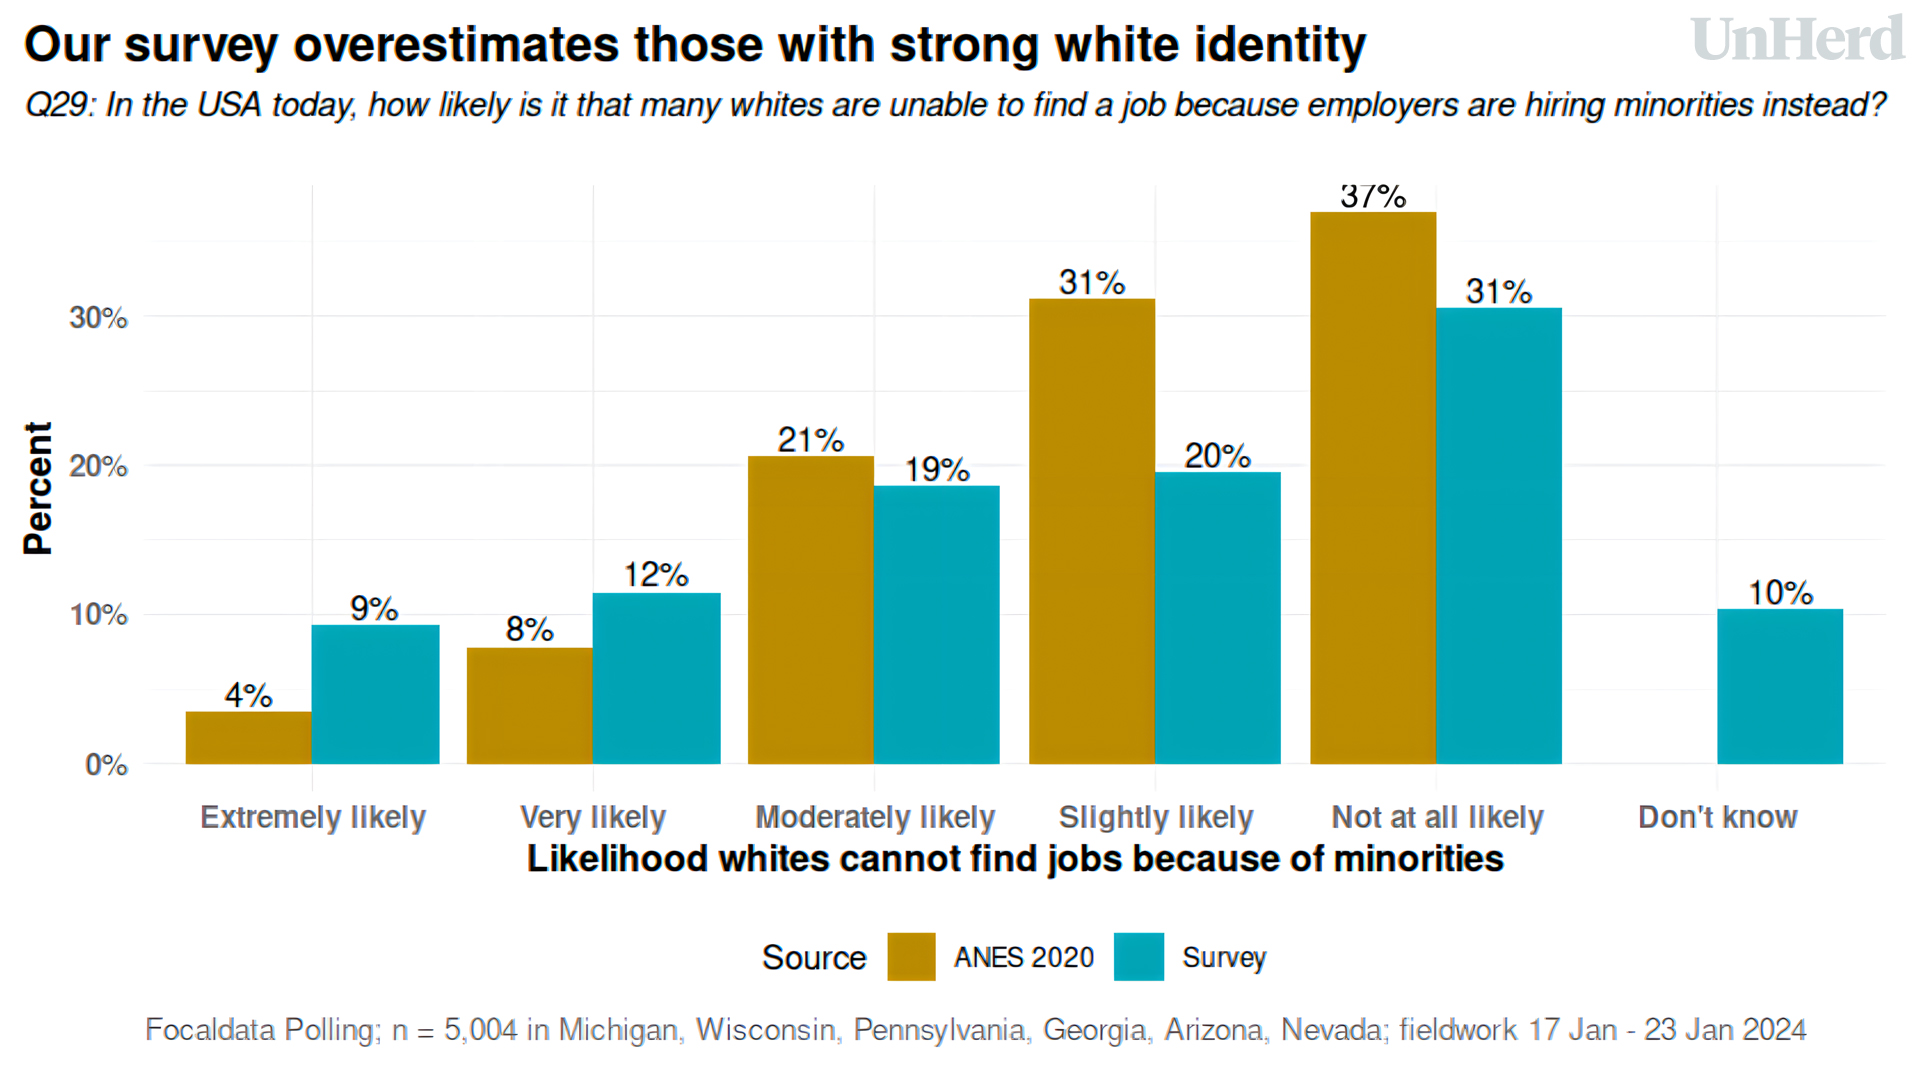
As a result, it is possible that we are over-sampling low-trust, anti-establishment and strong white-identity voters — something which, if true, would lead to the Democrats doing a little bit better than polls predict. And come November, that “little bit better” could make all the difference. Biden might be polling behind Trump for now, but when you stack up the reasons why he could win, his re-election is much more likely than many would have you think.
Disclaimer
Some of the posts we share are controversial and we do not necessarily agree with them in the whole extend. Sometimes we agree with the content or part of it but we do not agree with the narration or language. Nevertheless we find them somehow interesting, valuable and/or informative or we share them, because we strongly believe in freedom of speech, free press and journalism. We strongly encourage you to have a critical approach to all the content, do your own research and analysis to build your own opinion.
We would be glad to have your feedback.

Source: UnHerd Read the original article here: https://unherd.com/