Election 2024: Analysis and Predictions
by Josh Stevenson at Brownstone Institute

Introduction
The goal of this modeling project was to predict the outcome of the 2024 election using public health, demographic, and historical data. The unique approach relies on predictors that are a proxy for public support for the Democratic Party within a population. In the US, we are faced with a binary choice, Democrat or Republican, and our election is decided by Electoral votes from each state. Therefore, the response metric predicted was simply the margin of victory within a state.
Because of the Electoral College, predicting the election is essentially a matter of predicting a handful of states. Most states have a reliable history of a wide margin of victory for one party or the other, while a few do not. The data and model will be accurate to the extent that they accurately predict these states. Due to the smaller sample size of recent national elections and the importance of recent data points in the model, it will not be capable of producing highly precise predictions for states with slim margins of victory. Therefore, the success of this model will hinge on its ability to detect which swing states might have more support for Democrats (or Republicans) than what is currently being detected in the polls.
Background and Assumptions
Over the last two presidential election cycles, we have seen public polling fail in major ways. In 2016, almost every major polling and media outlet failed to detect the degree of public support among Democrats and Independents that led to Trump’s victory in key swing states and the Rust Belt. In 2020, polling outlets again underestimated Trump’s support in key states. Since then, trust in the media’s ability to investigate and get at the truth has further eroded.
This analysis seeks to find predictors that reflect a more accurate state of the public’s political preference that are not subject to the weaknesses of the polling industry’s biases. Due to the hyper-polarized nature of the Covid-19 pandemic, and the explicitly clear lines where support for the Covid-19 shot fell, public uptake for each year’s “new” version of a Covid-19 shot is highly correlated with support for the Democratic Party. Because there is a new Covid-19 shot every year, continued uptake is assumed to indicate Democratic vote allegiance. Other indicators, such as domestic migration rate and mail-in ballot requests, are strongly correlated with Democratic support over the last four years.
In addition, population data from public health sources have been used as controlling or predictive variables, including mortality rate, birth rate, and mental health. Some demographic and population dynamics are associated with more Republican-leaning states and others with Democratic-leaning states, and these relationships have held over time in recent history. Other measures, like net migration rate, have strong associations, but those are more recent and were affected by the Covid-19 pandemic, during which many locked-down blue states saw a net loss, and red open states saw a net gain. The popularity of the now annual Covid-19 shot is waning year over year, and the data has been adjusted to measure relative popularity, with states with higher overall uptake than average reflecting higher Democratic party support.
Overall, this analysis seeks to combine both longer-term trends and more recent trends in order to estimate the current level of support for the Democratic Party. As the model must be trained on data only made available in the months (Covid-Vax) and weeks (absentee ballot requests) leading up to the election, it will be unable to detect any 11th-hour shifts.
As George Box said, “All models are wrong, but some are useful.” My hope with this analysis is that it might be useful to detect signals that might not be present in traditional election polling. In addition to prediction (which is mostly for fun), I have included some swing state analysis that I think might shed some light on key shifts that have been happening over the last four years.
Methods
Because explainability and interpretation are critical in the election context, I have stuck with simple models. Generalized Linear Modeling, Logistic Regression, and Random Forest models were all trained on data from 2020-2022. The outcome, or response, was the margin of Democratic Party victory. For the logistic model, the response predicted was a binary win or loss for that state. Because each model has its own strengths and weaknesses, along with its own error rates, the final classification of a win or loss will be determined by the majority vote. I have uploaded my code and data to github, and anyone is welcome to critique, correct, or provide feedback.
Limitations
Because of my decision to use Covid-19 shot uptake among states as a predictor, this limits the timeline and data that can be collected. Due to this, I expect the model will have a bias toward the Democrats. Out of 50 states, five fell within the range of errors. All five of those states are considered swing states. For categorization purposes, only states that fall clearly outside of the errors of my models will be categorized as a win for that party. The ones within the error ranges will be categorized as toss-ups.
Discussion
Because in the US, elections are a binary choice, the analysis looks at only Democrat vs. Republican and cannot detect shifts in support for a candidate among voters of the opposite party. This reveals a core assumption of the model, that this election is still primarily about party allegiance over the individual candidate.
For the Democratic candidate Kamala Harris, I believe this assumption holds true, as she was not elected via popular vote during the primary, and much of the campaign has been about creating a strategically crafted persona out of a woman who until recently had been largely ignored, dismissed, and even mocked. We can see that over the last few months, the debates, assassination attempts, and other major moments have simply not had any major effect on the polling trends.
For Donald Trump, I do not believe this assumption holds. Trump’s well-known persona is dominant and ubiquitous. From his presidency from 2017-2021 and his continued battles with lawsuits, assassination attempts, and media obsession, Trump’s winning says much more about him than the Republican Party. The Democratic Party is a machine, and the Republican Party only reluctantly solidified support for Trump after years of infighting and division among its leaders.
As the model uses data from both the Presidential Election in 2020 and the Senate Elections in 2022, it is trained to model party support, thus its inherent weakness. Recent polling has shifted in Trump’s favor, but has major swing states in dead heats. Sticking true to my methods and the intent of this exercise, none of that data is included.
Swing State Analysis
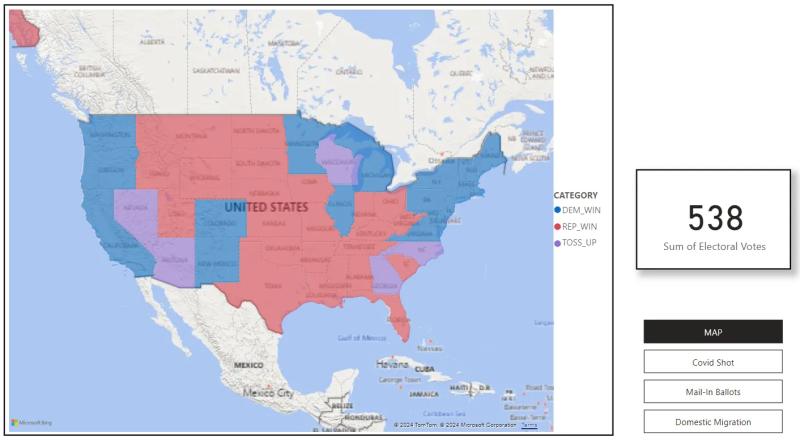
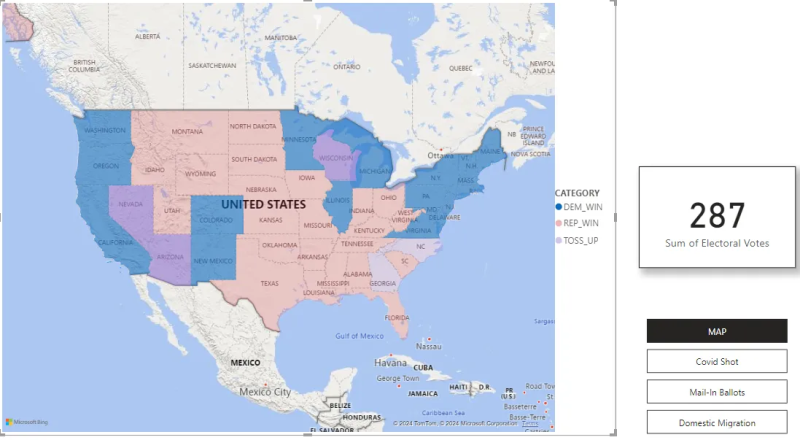
The outcome of the election will be determined by a handful of states. Currently, the close races in Arizona, Nevada, Wisconsin, Michigan, North Carolina, Georgia, and Pennsylvania are enough to swing the election in either’s favor. Of those states, the model categorized Michigan and Pennsylvania as safely swinging Democratic. The remaining states were all within the model’s error range and so were categorized as toss-ups.
To provide some visual context for how this analysis works, here are a few breakdowns of some of the predictors for the states that are generally considered swing states.
Domestic Migration Rates: 2019-2023*

Overall, there’s a negative relationship between net migration rate and Democratic margin of victory. Over the last 4 years, many blue States have been losing people, while red states have gained. For these swing states, some are “red” with regard to Governors and state Government, and others are “blue.” Overall, Pennsylvania and Michigan are the only 2 that have had negative migration rates over the last 4 years.
Mail-In Ballot Requests

Some states, like California, Colorado, and Nevada, are “All Mail” states. This means that every registered voter is sent a paper ballot by default. With the exception of Utah (and possibly Nevada), almost all of these States are blue States and are solidly blue. Nevada is the only swing state that is an all-mail state, as you can see its requests stay flat. The general trend with most of the others except for Arizona is a decrease in Mail-In-Ballot requests.
Annual Covid-19 Shot Uptake**

Since the model uses annual Covid-shot uptake as a strong predictor of Democratic Party support, but the overall popularity is decreasing, the model uses relative scoring to compare each state with each other within the year. Aside from Wisconsin, the remaining states had slightly below-average Covid-19 shot uptake in 2021**, 2022, and 2024.
*Domestic migration rates are matched from the prior year.
**Because the Covid-19 shots were not available until 2021, the 2021 data were paired with 2020 election outcome data. For 2022 and 2024, data reflect the uptake for that year’s new version.
To get a sense of how important the predictors are to the model, the below chart ranks each measure for how much it affects one of the model’s predictions. As you can see, the Covid-19 shot uptake is ranked right under “previous Democratic Win.”

Results
The model has Harris safely winning 260 electoral votes from the states it predicts will be safely Democratic. If Pennsylvania and Michigan are in fact in contention, then only 226 of those are safely Democratic.
The model has Trump safely winning 219 electoral votes from the states it predicts will be safely Republican.
The swing states Wisconsin, Georgia, North Carolina, Nevada, and Arizona are all up for grabs, and represent 59 electoral votes. If Pennsylvania and Michigan are in the mix, that’s 93 electoral votes up for grabs.
Harris’s Path to Win
Harris’s path to victory looks easiest. With a higher starting Electoral Vote “in the bag,” she can collect a handful of swing states. Pennsylvania and Michigan are showing as wins for her in the model, and if she does win them, she simply needs any single one of Arizona, North Carolina, Wisconsin, or Georgia to lock it down. If she wins one or the other of Pennsylvania or Michigan, she then needs to replace the loss with 1-2 additional swing states.
Trump’s Path to Victory
It’s important to look at Trump’s path with an “anything can happen” mindset. He has outperformed expectations in both prior elections. Most information gatekeepers, mainstream pundits, and election pollsters have gotten it wrong in the past.
With 219 in the bag, Trump must take every single toss-up state of Arizona, Georgia, North Carolina, Wisconsin, and Nevada. If Trump wins Pennsylvania and/or Michigan, then his path becomes easier, meaning he would still need 2-3 of the remaining toss-ups.
Take a look at the Dashboard Below. Interact to see how either candidate’s path to victory by winning the toss-up states, and see scatterplots for predictions measured by state.

My Personal Predictions Based on the Model
I have more of an intuition about North Carolina and Georgia since I spend time there, and I am calling those for Trump. I do not have that intuition for Arizona, Nevada, or Wisconsin. So take this with a grain of salt. But being true to the method, My model calls Pennsylvania and Michigan for Harris, and I believe she will take at least 2-3 additional swing states. I hope I’m wrong.

References:
MIT Election Lab https://electionlab.mit.edu/data#data
USA Facts https://usafacts.org/economy/
UF Election Lab https://election.lab.ufl.edu/voter-turnout/
Voting and Registration in the Election of November 2022 https://www.census.gov/data/tables/time-series/demo/voting-and-registration/p20-586.html
CDC https://data.cdc.gov/NCHS/Indicators-of-Anxiety-or-Depression-Based-on-Repor/8pt5-q6wp/about_data
CMS https://data.cms.gov/provider-data/dataset/avax-cv19
CDC https://www.cdc.gov/covidvaxview/weekly-dashboard/vaccine-administration-coverage-jurisdiction.html
Five Thirty Eight https://github.com/fivethirtyeight/election-results/blob/main/election_results_senate.csv
KFF Vaccine Monitor https://www.kff.org/coronavirus-covid-19/dashboard/kff-covid-19-vaccine-monitor-dashboard/
UF Election Lab https://election.lab.ufl.edu/2024-presidential-nomination-contests-turnout-rates/
National Center for Health Statistics https://www.cdc.gov/nchs/data_access/VitalStatsOnline.htm CDC https://www.cdc.gov/nchs/data/vsrr/vsrr035.pdf Census.Gov https://www.census.gov/data/tables/time-series/demo/popest/2020s-state-total.htmlCDC https://www.cdc.gov/covidvaxview/interactive/adults.html
National Center for Health Statistics https://www.cdc.gov/nchs/fastats/state-and-territorial-data.htm
Census- Poverty https://www.census.gov/data/tables/time-series/demo/income-poverty/historical-poverty-people.html
Census- Population Change by State https://www.census.gov/newsroom/press-kits/2023/national-state-population-estimates.html
US Election Project https://electproject.github.io/
Republished from the author’s Substack
Election 2024: Analysis and Predictions
by Josh Stevenson at Brownstone Institute – Daily Economics, Policy, Public Health, Society
Disclaimer
Some of the posts we share are controversial and we do not necessarily agree with them in the whole extend. Sometimes we agree with the content or part of it but we do not agree with the narration or language. Nevertheless we find them somehow interesting, valuable and/or informative or we share them, because we strongly believe in freedom of speech, free press and journalism. We strongly encourage you to have a critical approach to all the content, do your own research and analysis to build your own opinion.
We would be glad to have your feedback.
Source: Brownstone Institute Read the original article here: https://brownstone.org/

